Reebok 2011 Annual Report Download - page 132
Download and view the complete annual report
Please find page 132 of the 2011 Reebok annual report below. You can navigate through the pages in the report by either clicking on the pages listed below, or by using the keyword search tool below to find specific information within the annual report.-
 1
1 -
2
-
3
-
4
-
5
-
6
-
7
-
8
-
9
-
10
-
11
-
12
-
13
-
14
-
15
-
16
-
17
-
18
-
19
-
20
-
21
-
22
-
23
-
24
-
25
-
26
-
27
-
28
-
29
-
30
-
31
-
32
-
33
-
34
-
35
-
36
-
37
-
38
-
39
-
40
-
41
-
42
-
43
-
44
-
45
-
46
-
47
-
48
-
49
-
50
-
51
-
52
-
53
-
54
-
55
-
56
-
57
-
58
-
59
-
60
-
61
-
62
-
63
-
64
-
65
-
66
-
67
-
68
-
69
-
70
-
71
-
72
-
73
-
74
-
75
-
76
-
77
-
78
-
79
-
80
-
81
-
82
-
83
-
84
-
85
-
86
-
87
-
88
-
89
-
90
-
91
-
92
-
93
-
94
-
95
-
96
-
97
-
98
-
99
-
100
-
101
-
102
-
103
-
104
-
105
-
106
-
107
-
108
-
109
-
110
-
111
-
112
-
113
-
114
-
115
-
116
-
117
-
118
-
119
-
120
-
121
-
 122
122 -
 123
123 -
 124
124 -
 125
125 -
 126
126 -
 127
127 -
 128
128 -
 129
129 -
 130
130 -
 131
131 -
 132
132 -
 133
133 -
 134
134 -
 135
135 -
 136
136 -
 137
137 -
 138
138 -
 139
139 -
 140
140 -
 141
141 -
 142
142 -
143
-
144
-
145
-
146
-
147
-
148
-
149
-
150
-
151
-
152
-
153
-
154
-
155
-
156
-
157
-
158
-
159
-
160
-
161
-
162
-
163
-
164
-
165
-
166
-
167
-
168
-
169
-
170
-
171
-
172
-
173
-
174
-
175
-
176
-
177
-
178
-
179
-
180
-
181
-
182
-
183
-
184
-
185
-
186
-
187
-
188
-
189
-
190
-
191
-
192
-
193
-
194
-
195
-
196
-
197
-
198
-
199
-
200
-
201
-
202
-
203
-
204
-
205
-
206
-
207
-
208
-
209
-
210
-
211
-
212
-
213
-
214
-
215
-
216
-
217
-
218
-
219
-
220
-
221
-
222
-
223
-
224
-
225
-
226
-
227
-
228
-
229
-
230
-
231
-
232
-
233
-
234
-
235
-
236
-
237
-
238
-
239
-
240
-
241
-
242
 |
 |
adidas Group
2011 Annual Report
GROUP MANAGEMENT REPORT – FINANCIAL REVIEW
128
2011
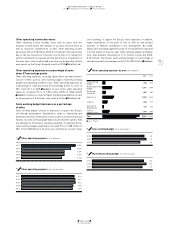
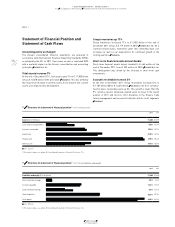
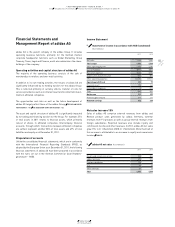
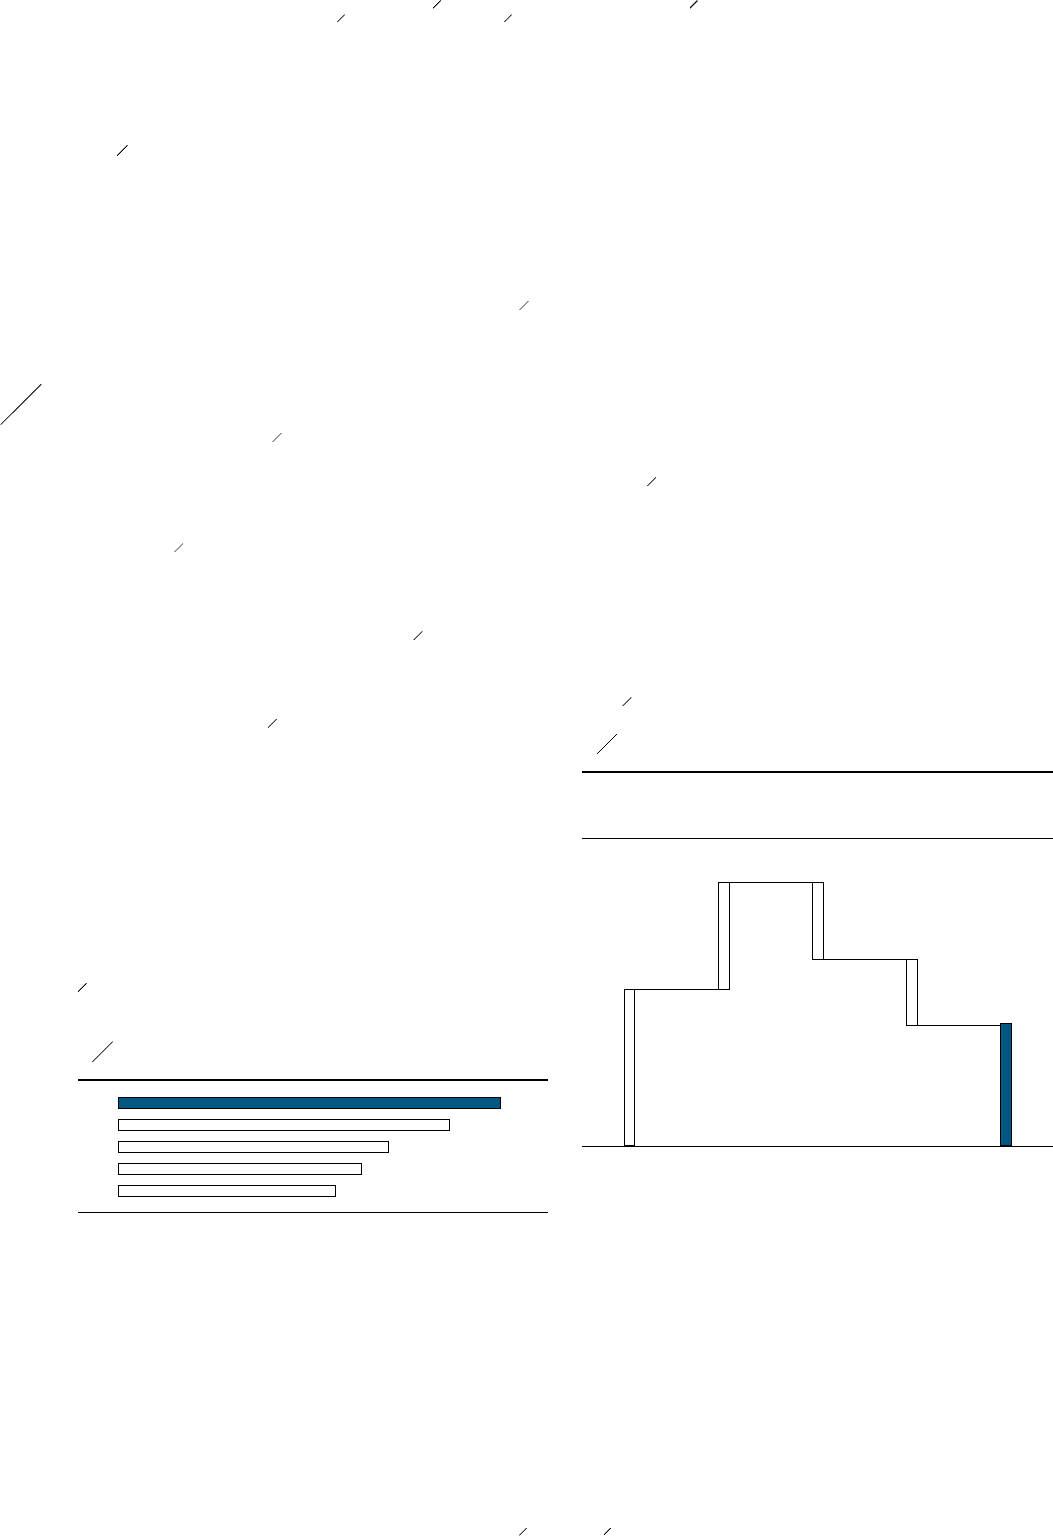
Cash flow remains strong
In 2011, net cash inflow from operating activities was € 792 million
(2010: € 894 million). The decrease in cash generated from operating
activities compared to the prior year was primarily due to higher income
taxes paid, as well as higher operating working capital requirements,
partly offset by the improved Group profitability. Net cash outflow
from investing activities was € 566 million (2010: € 330 million). This
was mainly related to spending for property, plant and equipment
such as investments in the furnishing and fitting of stores in our
Retail segment, in new office buildings and in IT systems, as well as
to the purchase of short-term financial assets and the acquisition of
Five Ten
SEE NOTE 03, P. 188
. Net cash outflow from financing activities
totalled € 491 million (2010: € 238 million). Cash outflows from
financing activities were mainly related to the repayment of short-
term borrowings totalling € 273 million, dividends paid in an amount
of € 167 million as well as the repayment of long-term borrowings
in an amount of € 48 million. Exchange rate effects in an amount of
€ 15 million positively impacted the Group’s cash position in 2011
(2010: € 55 million). As a result of all these developments, cash and
cash equivalents decreased € 250 million to € 906 million at the end
of December 2011 compared to € 1.156 billion at the end of December
2010
DIAGRAM 40
.
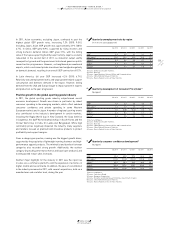
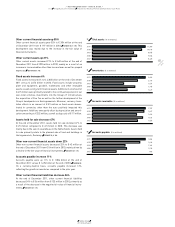
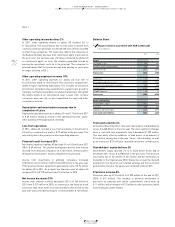
Other current provisions up 8%
Other current provisions were up 8% to € 507 million at the end of
2011 versus € 470 million at the end of 2010. This primarily relates to
increases in provisions for returns, allowances and warranties
SEE
NOTE 19, P. 194
.
Current accrued liabilities grow 18%
Current accrued liabilities increased 18% to € 990 million at the end of
2011 from € 842 million in 2010, mainly due to an increase in accruals
for invoices not yet received
SEE NOTE 20, P. 195
.
Other current liabilities up 24%
Other current liabilities were up 24% to € 301 million at the end of
2011 from € 241 million in 2010, mainly due to increases in customer
prepayments
SEE NOTE 21, P. 196
.
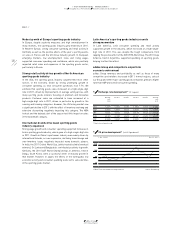
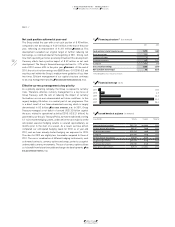
Shareholders’ equity grows 15%
Shareholders’ equity increased 15% to € 5.327 billion at the end of
December 2011 versus € 4.616 billion in 2010
DIAGRAM 39
. The net
income generated during the last twelve months and the increase
in the fair value of financial instruments were the main contributors
to this develop ment, partially offset by the dividend in an amount of
€ 167 million paid in 2011
SEE NOTE 25, P. 198
. The Group’s equity ratio
at the end of December 2011 was 46.8% compared to 43.5% in the
prior year.
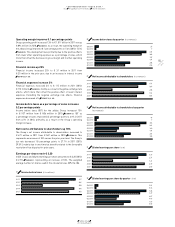
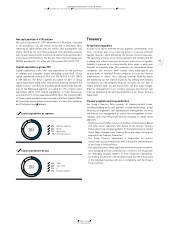
Expenses related to off-balance sheet items
Our most significant off-balance sheet commitments are operating
leases, which are related to own-retail stores, offices, warehouses
and equipment. The Group has entered into various operating leases
as opposed to property acquisitions in order to reduce exposure
to property value fluctuations. Rent expenses increased 12% to
€ 608 million in 2011 from € 544 million in the prior year, mainly due
to the continued expansion of the adidas Group’s own-retail activities
SEE NOTE 27, P. 201
.
03.2 Group Business Performance Statement of Financial Position and Statement of Cash Flows
03.2
40 Change in cash and cash equivalents (€ in millions)
Cash and cash
equivalents at the
end of 2010 1)
Net cash generated
from operating
activities
Net cash used
in investing
activities
Net cash used
in financing
activities
Cash and cash
equivalents at the
end of 2011 2)
1) Includes a positive exchange rate effect of € 55 million.
2) Includes a positive exchange rate effect of € 15 million.
1,156
792 (566)
(491)
906
39 Shareholders’ equity (€ in millions)
2011 5,327
2010 4,616
2009 3,771
2008 3,386
2007 3,023