Reebok 2011 Annual Report Download - page 189
Download and view the complete annual report
Please find page 189 of the 2011 Reebok annual report below. You can navigate through the pages in the report by either clicking on the pages listed below, or by using the keyword search tool below to find specific information within the annual report.-
 1
1 -
2
-
3
-
4
-
5
-
6
-
7
-
8
-
9
-
10
-
11
-
12
-
13
-
14
-
15
-
16
-
17
-
18
-
19
-
20
-
21
-
22
-
23
-
24
-
25
-
26
-
27
-
28
-
29
-
30
-
31
-
32
-
33
-
34
-
35
-
36
-
37
-
38
-
39
-
40
-
41
-
42
-
43
-
44
-
45
-
46
-
47
-
48
-
49
-
50
-
51
-
52
-
53
-
54
-
55
-
56
-
57
-
58
-
59
-
60
-
61
-
62
-
63
-
64
-
65
-
66
-
67
-
68
-
69
-
70
-
71
-
72
-
73
-
74
-
75
-
76
-
77
-
78
-
79
-
80
-
81
-
82
-
83
-
84
-
85
-
86
-
87
-
88
-
89
-
90
-
91
-
92
-
93
-
94
-
95
-
96
-
97
-
98
-
99
-
100
-
101
-
102
-
103
-
104
-
105
-
106
-
107
-
108
-
109
-
110
-
111
-
112
-
113
-
114
-
115
-
116
-
117
-
118
-
119
-
120
-
121
-
122
-
123
-
124
-
125
-
126
-
127
-
128
-
129
-
130
-
131
-
132
-
133
-
134
-
135
-
136
-
137
-
138
-
139
-
140
-
141
-
142
-
143
-
144
-
145
-
146
-
147
-
148
-
149
-
150
-
151
-
152
-
153
-
154
-
155
-
156
-
157
-
158
-
159
-
160
-
161
-
162
-
163
-
164
-
165
-
166
-
167
-
168
-
169
-
170
-
171
-
172
-
173
-
174
-
175
-
176
-
177
-
178
-
 179
179 -
 180
180 -
 181
181 -
 182
182 -
 183
183 -
 184
184 -
 185
185 -
 186
186 -
 187
187 -
 188
188 -
 189
189 -
 190
190 -
 191
191 -
 192
192 -
 193
193 -
 194
194 -
 195
195 -
 196
196 -
 197
197 -
 198
198 -
 199
199 -
200
-
201
-
202
-
203
-
204
-
205
-
206
-
207
-
208
-
209
-
210
-
211
-
212
-
213
-
214
-
215
-
216
-
217
-
218
-
219
-
220
-
221
-
222
-
223
-
224
-
225
-
226
-
227
-
228
-
229
-
230
-
231
-
232
-
233
-
234
-
235
-
236
-
237
-
238
-
239
-
240
-
241
-
242
 |
 |

adidas Group
2011 Annual Report
CONSOLIDATED FINANCIAL STATEMENTS
04.8 Notes
185
2011
185
2011
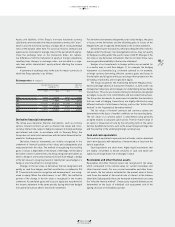
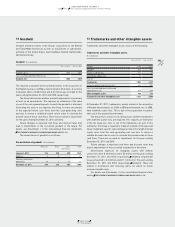
Intangible assets (except goodwill)
Intangible assets are valued at amortised cost less accumulated amor-
tisation (except for assets with indefinite useful lives) and impairment
losses. Amortisation is calculated on a straight-line basis taking into
account any potential residual value.
Estimated useful lives are as follows:
Estimated useful lives of intangible assets
Years
Trademarks indefinite
Software 3 – 5
Patents, trademarks and concessions 5 – 15
The adidas Group determined that there was no impairment neces-
sary for any of its trademarks with indefinite useful lives in the years
ending December 31, 2011 and 2010.
The recoverable amount is determined on the basis of fair value
less costs to sell (costs to sell are calculated with 1% of the fair value).
The fair value is determined in discounting notional royalty savings
after tax and adding a tax amortisation benefit, resulting from the
amortisation of the acquired asset (“relief-from-royalty method”).
These calculations use projections of net sales related royalty savings,
based on financial planning which covers a period of five years in total.
The level of the applied royalty rate for the determination of the royalty
savings is based on contractual agreements between the adidas Group
and external licensees as well as publicly available royalty rate agree-
ments for similar assets. Notional royalty savings beyond this period
are extrapolated using steady growth rates of 1.7% (2010: 1.7%). The
growth rates do not exceed the long-term average growth rate of the
business to which the trademarks are allocated.
The discount rate is based on a weighted average cost of capital
calculation derived using a five-year average market-weighted debt/
equity structure and financing costs referencing the Group’s major
competitors. The discount rate used is an after-tax rate and reflects
the specific equity and country risk. The applied discount rate depends
on the respective intangible asset being valued and ranges between
6.5% and 8.1% (2010: between 6.4% and 8.3%).
Expenditures during the development phase of internally
generated intangible assets are capitalised when they occur if they
qualify for recognition under IAS 38 “Intangible Assets”.
Goodwill
Goodwill is an asset representing the future economic benefits arising
from assets acquired in a business combination that are not indi-
vidually identified and separately recognised. This results when the
purchase cost exceeds the fair value of acquired identifiable assets,
liabilities and contingent liabilities. Goodwill arising from the acquisi-
tion of a foreign entity and any fair value adjustments to the carrying
amounts of assets, liabilities and contingent liabilities of that foreign
entity are treated as assets, liabilities and contingent liabilities of
the respective reporting entity, and are translated at exchange rates
prevailing at the date of the initial consolidation. Goodwill is carried in
the functional currency of the acquired foreign entity.
Acquired goodwill is valued at cost and is tested for impairment
on an annual basis and additionally when there are indications of
potential impairment.
On August 4, 2011, the Group published the error findings of the
German Financial Reporting Enforcement Panel (FREP) regarding
the inconsistency between the designation of segments and of cash-
generating units on which the impairment test for goodwill is based.
As a consequence, the cash-generating units were redefined. The
geographic regions responsible for the joint distribution of adidas
and Reebok were split into Wholesale and Retail for purposes of
impairment testing. As a result of the redefinition of cash-generating
units, the number of cash-generating units increased to 30 from 19,
including the other operating segments TaylorMade-adidas Golf,
Rockport and Reebok-CCM Hockey.
The cash-generating units (or groups of units) represent the
lowest level within the Group at which goodwill is monitored for
internal management purposes.
The impairment test for goodwill has been performed based on
cash-generating units (or groups of units).
Overall, no impairment of goodwill resulted.
The recoverable amount of a cash-generating unit is determined
on the basis of value in use. This calculation uses cash flow projec-
tions based on the financial planning covering a five-year period in
total. The planning is based on the adidas Group’s strategic business
plan “Route 2015”
SEE SUBSEQUENT EVENTS AND OUTLOOK, P. 163
and reflects an
expected mid- to high-single-digit sales increase for the majority of
the cash-generating units (or groups of units). For a few emerging
markets, we expect, on average, a low-double-digit sales growth rate.
Furthermore, we expect the operating margin to improve, primarily
driven by a slight improvement in the gross margin as well as lower
operating expenses as a percentage of sales. The planning for capital
expenditure and working capital is primarily based on past experience.
The planning for future tax payments is based on current statutory
corporate tax rates of the single cash-generating units (or groups of
units). Cash flows beyond this period are extrapolated using steady
growth rates of 1.7% (2010: 1.7%). According to our expectations,
these growth rates do not exceed the long-term average growth rate
of the business in which each cash-generating unit operates.