Reebok 2011 Annual Report Download - page 154
Download and view the complete annual report
Please find page 154 of the 2011 Reebok annual report below. You can navigate through the pages in the report by either clicking on the pages listed below, or by using the keyword search tool below to find specific information within the annual report.-
 1
1 -
2
-
3
-
4
-
5
-
6
-
7
-
8
-
9
-
10
-
11
-
12
-
13
-
14
-
15
-
16
-
17
-
18
-
19
-
20
-
21
-
22
-
23
-
24
-
25
-
26
-
27
-
28
-
29
-
30
-
31
-
32
-
33
-
34
-
35
-
36
-
37
-
38
-
39
-
40
-
41
-
42
-
43
-
44
-
45
-
46
-
47
-
48
-
49
-
50
-
51
-
52
-
53
-
54
-
55
-
56
-
57
-
58
-
59
-
60
-
61
-
62
-
63
-
64
-
65
-
66
-
67
-
68
-
69
-
70
-
71
-
72
-
73
-
74
-
75
-
76
-
77
-
78
-
79
-
80
-
81
-
82
-
83
-
84
-
85
-
86
-
87
-
88
-
89
-
90
-
91
-
92
-
93
-
94
-
95
-
96
-
97
-
98
-
99
-
100
-
101
-
102
-
103
-
104
-
105
-
106
-
107
-
108
-
109
-
110
-
111
-
112
-
113
-
114
-
115
-
116
-
117
-
118
-
119
-
120
-
121
-
122
-
123
-
124
-
125
-
126
-
127
-
128
-
129
-
130
-
131
-
132
-
133
-
134
-
135
-
136
-
137
-
138
-
139
-
140
-
141
-
142
-
143
-
 144
144 -
 145
145 -
 146
146 -
 147
147 -
 148
148 -
 149
149 -
 150
150 -
 151
151 -
 152
152 -
 153
153 -
 154
154 -
 155
155 -
 156
156 -
 157
157 -
 158
158 -
 159
159 -
 160
160 -
 161
161 -
 162
162 -
 163
163 -
 164
164 -
165
-
166
-
167
-
168
-
169
-
170
-
171
-
172
-
173
-
174
-
175
-
176
-
177
-
178
-
179
-
180
-
181
-
182
-
183
-
184
-
185
-
186
-
187
-
188
-
189
-
190
-
191
-
192
-
193
-
194
-
195
-
196
-
197
-
198
-
199
-
200
-
201
-
202
-
203
-
204
-
205
-
206
-
207
-
208
-
209
-
210
-
211
-
212
-
213
-
214
-
215
-
216
-
217
-
218
-
219
-
220
-
221
-
222
-
223
-
224
-
225
-
226
-
227
-
228
-
229
-
230
-
231
-
232
-
233
-
234
-
235
-
236
-
237
-
238
-
239
-
240
-
241
-
242
 |
 |

adidas Group
2011 Annual Report
GROUP MANAGEMENT REPORT – FINANCIAL REVIEW
150
2011
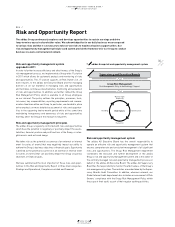
03.4 Risk and Opportunity Report Strategic and operational risks
03.4
Reputation/brand image risks
The adidas Group faces considerable risk if we are unable to uphold
high levels of consumer awareness, affiliation and purchase intent
for our brands. Negative media coverage on our products or business
practices, unfavourable stakeholder activism and speed and influence
of social media discussion may significantly hurt the Group’s reputation
and brand image and eventually lead to a sales slowdown. In addition,
if the Group’s brands are not allocating sufficient marketing resources
to activate our sports assets and brand campaigns in a sustainable
manner, we face the risk of fading consumer awareness and brand
attractiveness. To mitigate these risks, we pursue pro-active, open
communication with key stakeholders (e.g. consumers, media,
non-governmental organisations, financial community, etc.) on a
continuous basis. We have also defined clear mission statements,
values and goals for all our brands
SEE GLOBAL BRANDS STRATEGY, P. 68
SEE
OTHER BUSINESSES STRATEGY, P. 82
. These form the foundation of our product
and brand communication strategies. Furthermore, we continue to
invest significant marketing resources to build brand momentum and
foster consumer awareness.
We continue to believe that a considerable deterioration in the Group’s
reputation and the image of our brands could have a significant
financial impact on our Group. As a result of ever-increasing media
and other stakeholder activities worldwide, coupled with the fast-
moving and hardly controllable nature of social media, we consider
reputation and brand image risks more likely to materialise and have
therefore increased the likelihood of occurrence to probable.
Own-retail risks
New adidas, Reebok and Rockport own-retail stores require consid-
erable up-front investment in furniture and fixtures as well as ongoing
maintenance. In addition, own-retail activities often require longer-
term lease or rent commitments. Retail also employs significantly
more personnel in relation to sales than our wholesale business. The
higher portion of fixed costs compared to our wholesale business
implies a larger profitability impact in cases of significant sales
declines. Delayed openings or poorly executed store operations
could lead to sales shortfalls and also negatively affect brand image.
Further, inability to secure appropriate store locations may result in
worse than expected sales development.
The Group reduces this risk by only entering into lease contracts
with durations of less than ten years. Store openings are managed
according to a standardised Group-wide business plan model. Store
performance is measured by a retail scorecard consisting of nine
quantitative key performance indicators. Underperforming stores are
reorganised, remodelled or closed as appropriate.
Our increased focus on improving our sophistication as a retailer
by investing in management expertise as well as in IT systems
remains a key priority for 2012
SEE GLOBAL SALES STRATEGY, P. 62
. Never-
theless, we continue to view the risk of underperformance of some
of our own-retail stores as likely. The potential financial impact from
own-retail underperformance, which may also involve impairment
charges and store closures, is moderate.
Risks related to rising input costs
Raw material and labour costs account for approximately 70% of the
Group’s cost of sales. Prices of materials such as rubber, cotton,
polyester and those which closely correlate with the oil price are
especially subject to the risk of price changes. As our ordering process
and price negotiations usually take place around six months in advance
of production, our sourcing function has visibility and reaction time to
reflect sharp increases in input costs in its planning.
To reduce the financial impact on our product margins from higher
sourcing costs, we are implementing further lean manufacturing
techniques at our partner factories, reducing time and cost in the
procurement process, re-engineering our products and selec-
tively increasing prices where possible. In addition, the Profitability
Management department within the Global Operations function is
mandated with driving strategic initiatives to ensure competitiveness
of our supply chain in light of increasing input costs
SEE GLOBAL
OPERATIONS, P. 90
. In the medium term, we also have the ability to adapt
our sourcing structure to take advantage of more competitive pricing
in other locations.
As a result of the high degree of volatility on global commodity
markets in 2011 as well as currently increasing labour costs, we do
not forecast any positive impact on our sourcing costs in 2012. As we
begin planning for 2013, increases in sourcing costs cannot be ruled
out. Therefore, we continue to assess the risks related to rising input
costs as having a highly probable likelihood of occurrence and a major
potential financial impact.
Supplier risks
Almost the entire adidas Group product offering is sourced through
independent suppliers, mainly located in Asia
SEE GLOBAL OPERATIONS, P. 90
.
To reduce the risk of business interruptions following the potential
underperformance of a supplier, the relocation of a supplier’s
production sites or a potential supplier default, we work with vendors
who demonstrate reliability, quality, innovation and continuous
improvement.