Pep Boys 2006 Annual Report Download - page 97
Download and view the complete annual report
Please find page 97 of the 2006 Pep Boys annual report below. You can navigate through the pages in the report by either clicking on the pages listed below, or by using the keyword search tool below to find specific information within the annual report.-
 1
1 -
2
-
3
-
4
-
5
-
6
-
7
-
8
-
9
-
10
-
11
-
12
-
13
-
14
-
15
-
16
-
17
-
18
-
19
-
20
-
21
-
22
-
23
-
24
-
25
-
26
-
27
-
28
-
29
-
30
-
31
-
32
-
33
-
34
-
35
-
36
-
37
-
38
-
39
-
40
-
41
-
42
-
43
-
44
-
45
-
46
-
47
-
48
-
49
-
50
-
51
-
52
-
53
-
54
-
55
-
56
-
57
-
58
-
59
-
60
-
61
-
62
-
63
-
64
-
65
-
66
-
67
-
68
-
69
-
70
-
71
-
72
-
73
-
74
-
75
-
76
-
77
-
78
-
79
-
80
-
81
-
82
-
83
-
84
-
85
-
86
-
 87
87 -
 88
88 -
 89
89 -
 90
90 -
 91
91 -
 92
92 -
 93
93 -
 94
94 -
 95
95 -
 96
96 -
 97
97 -
 98
98 -
 99
99 -
 100
100 -
 101
101 -
 102
102 -
 103
103 -
 104
104 -
 105
105 -
 106
106 -
 107
107 -
108
-
109
-
110
-
111
-
112
-
113
-
114
-
115
-
116
-
117
-
118
-
119
-
120
-
121
-
122
-
123
-
124
-
125
-
126
-
127
-
128
-
129
-
130
-
131
-
132
-
133
-
134
-
135
-
136
 |
 |

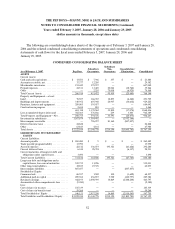
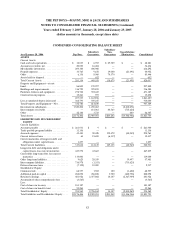
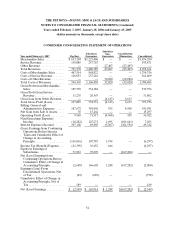
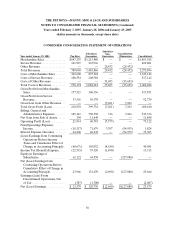
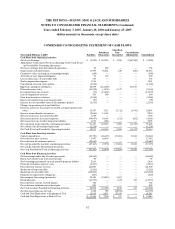
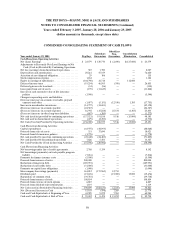
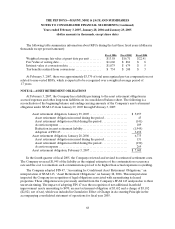
THE PEP BOYS—MANNY, MOE & JACK AND SUBSIDIARIES
NOTES TO CONSOLIDATED FINANCIAL STATEMENTS (Continued)
Years ended February 3, 2007, January 28, 2006 and January 29, 2005
(dollar amounts in thousands, except share data)
58
CONDENSED CONSOLIDATING STATEMENT OF CASH FLOWS
Year ended January 28, 2006 Pep Boys
Subsidiary
Guarantors
Subsidiary
Non-
Guarantors
Consolidation
Elimination Consolidated
Cash Flows from Operating Activities:
Net (Loss) Earnings . . . . . . . . . . . . . . . . . . . . . . . . . . . . . . . . . $ (37,528) $ 95,165 $ (354) $(94,811) $ (37,528)
Adjustments to Reconcile Net (Loss) Earnings to Net Cash
(Used in) Provided By Continuing Operations:
Net loss (earnings) from discontinued operations . . . . . . . . . . . (324) 32 — — (292)
Depreciationandamortization......................... 29,391 50,496 — — 79,887
Cumulativeeffectofchangeinaccountingprinciple......... 854 1,167 — — 2,021
Accretion of asset disposal obligation . . . . . . . . . . . . . . . . . . . . 25 84 — — 109
Stock compensation expense. . . . . . . . . . . . . . . . . . . . . . . . . . . 2,049 — — — 2,049
Equityinearningsofsubsidiaries....................... 65,004 (159,815) — 94,811 —
Deferredincometaxes............................... (18,604) (8,497) (691) — (27,792)
Net gain from reduction in asset retirement liability . . . . . . . . . (657) (1,158) — — (1,815)
Loss (gain) from sale of assets. . . . . . . . . . . . . . . . . . . . . . . . . . 675 (5,501) — — (4,826)
Loss on impairment of assets . . . . . . . . . . . . . . . . . . . . . . . . . . 4,200 — — — 4,200
Increase in cash surrender value of life insurance policies . . . . . (3,389) — — — (3,389)
Changes in operating assets and liabilities:
Decrease (increase) in accounts receivable, prepaid expenses
andother ....................................... 8,161 11,161 (3,073) (1,083) 15,166
Increase in merchandise inventories . . . . . . . . . . . . . . . . . . . . . (3,476) (10,056) — — (13,532)
(Decrease) increase in accounts payable . . . . . . . . . . . . . . . . . . (49,041) — — — (49,041)
(Decrease) increase in accrued expenses . . . . . . . . . . . . . . . . . . (20,019) 2,711 16,858 (18,414) (18,864)
(Decrease) increase in other long-term liabilities. . . . . . . . . . . . (2,913) 176 — 19,497 16,760
Net cash (used in) provided by continuing operations . . . . . . . . (25,592) (24,035) 12,740 — (36,887)
Net cash used in discontinued operations . . . . . . . . . . . . . . . . . (221) (1,279) — — (1,500)
Net Cash (Used in) Provided by Operating Activities . . . . . . . . (25,813) (25,314) 12,740 — (38,387)
Cash Flows from Investing Activities:
Capitalexpenditures................................. (16,455) (69,490) — — (85,945)
Proceedsfromsalesofassets........................... 978 3,065 — — 4,043
Proceeds from sales of assets held for disposal . . . . . . . . . . . . . — 6,913 — — 6,913
Proceedsfromlifeinsurancepolicies..................... 24,655 — — — 24,655
Premiums paid on life insurance policies. . . . . . . . . . . . . . . . . . (605) — — — (605)
Net cash provided by (used in) continuing operations . . . . . . . . 8,573 (59,512) — — (50,939)
Netcashprovidedbydiscontinuedoperations.............. 916 — — — 916
Net Cash Provided by (Used in) Investing Activities . . . . . . . . . 9,489 (59,512) — — (50,023)
Cash Flows from Financing Activities:
Net borrowings under line of credit agreements . . . . . . . . . . . . 19,685 38,300 — — 57,985
Net borrowings (payments) on trade payable program liability . 11,156 — — — 11,156
Payments for finance issuance costs . . . . . . . . . . . . . . . . . . . . . (5,150) — — — (5,150)
Proceedsfromissuanceofnotes........................ 200,000 — — — 200,000
Reductionoflong-termdebt........................... (183,459) — — — (183,459)
Payments on capital lease obligations . . . . . . . . . . . . . . . . . . . . (383) — — — (383)
Intercompanyborrowings(payments).................... (46,322) 45,005 1,317 — —
Dividendspaid..................................... (14,686) — — — (14,686)
Repurchase of common stock . . . . . . . . . . . . . . . . . . . . . . . . . . (15,562) — — — (15,562)
Proceedsfromexerciseofstockoptions .................. 3,071 — — — 3,071
Proceedsfromdividendreinvestmentplan................ 961 — — — 961
Net Cash (used in) Provided by Financing Activities . . . . . . . . . (30,689) 83,305 1,317 — 53,933
Net (Decrease) Increase in Cash. . . . . . . . . . . . . . . . . . . . . . . . (47,013) (1,521) 14,057 — (34,477)
CashandCashEquivalentsatBeginningofYear ........... 59,032 8,474 15,252 — 82,758
CashandCashEquivalentsatEndofYear................ $ 12,019 $ 6,953 $29,309 $ — $ 48,281