Pep Boys 2006 Annual Report Download - page 64
Download and view the complete annual report
Please find page 64 of the 2006 Pep Boys annual report below. You can navigate through the pages in the report by either clicking on the pages listed below, or by using the keyword search tool below to find specific information within the annual report.-
 1
1 -
2
-
3
-
4
-
5
-
6
-
7
-
8
-
9
-
10
-
11
-
12
-
13
-
14
-
15
-
16
-
17
-
18
-
19
-
20
-
21
-
22
-
23
-
24
-
25
-
26
-
27
-
28
-
29
-
30
-
31
-
32
-
33
-
34
-
35
-
36
-
37
-
38
-
39
-
40
-
41
-
42
-
43
-
44
-
45
-
46
-
47
-
48
-
49
-
50
-
51
-
52
-
53
-
 54
54 -
 55
55 -
 56
56 -
 57
57 -
 58
58 -
 59
59 -
 60
60 -
 61
61 -
 62
62 -
 63
63 -
 64
64 -
 65
65 -
 66
66 -
 67
67 -
 68
68 -
 69
69 -
 70
70 -
 71
71 -
 72
72 -
 73
73 -
 74
74 -
75
-
76
-
77
-
78
-
79
-
80
-
81
-
82
-
83
-
84
-
85
-
86
-
87
-
88
-
89
-
90
-
91
-
92
-
93
-
94
-
95
-
96
-
97
-
98
-
99
-
100
-
101
-
102
-
103
-
104
-
105
-
106
-
107
-
108
-
109
-
110
-
111
-
112
-
113
-
114
-
115
-
116
-
117
-
118
-
119
-
120
-
121
-
122
-
123
-
124
-
125
-
126
-
127
-
128
-
129
-
130
-
131
-
132
-
133
-
134
-
135
-
136
 |
 |

25
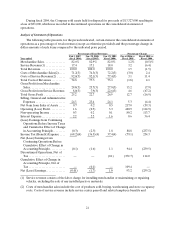
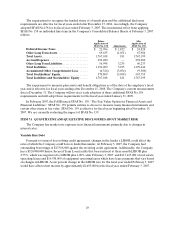
Industry Comparison
We operate in the U.S. automotive aftermarket, which has two general competitive arenas: the
Do-It-For-Me (“DIFM”) (service labor, installed merchandise and tires) market and the Do-It-Yourself
(“DIY”) (retail merchandise) market. Generally, the specialized automotive retailers focus on either the
“DIY” or “DIFM” areas of the business. We believe that operation in both the “DIY” and “DIFM” areas
of the business positively differentiates us from most of our competitors. Although we manage our store
performance at a store level in aggregation, we believe that the following presentation shows an accurate
comparison against competitors within the two sales arenas. We compete in the “DIY” area of the business
through our retail sales floor and commercial sales business (Retail Sales). Our Service Center business
(labor and installed merchandise and tires) competes in the “DIFM” area of the industry. The following
table presents the revenues and gross profit for each area of the business.
Year ended
(dollar amounts in thousands)
February 3,
2007
January 28,
2006
January 29,
2005
RetailSales(1) ............................................ $1,352,395 $1,356,784 $1,352,695
ServiceCenterRevenue(2) ................................. 919,766 881,245 920,201
TotalRevenues............................................ $2,272,161 $2,238,029 $2,272,896
GrossProfitfromRetailSales(3)............................ $ 381,247 $ 343,860 $ 355,270
Gross Profit from Service Center Revenue(3) . . . . . . . . . . . . . . . . . 190,509 163,407 255,340
TotalGrossProfit ......................................... $ 571,756 $ 507,267 $ 610,610
(1) Excludes revenues from installed products.
(2) Includes revenues from installed products.
(3) Gross Profit from Retail Sales includes the cost of products sold, buying, warehousing and store
occupancy costs. Gross Profit from Service Center Revenue includes the cost of installed products
sold, buying, warehousing, service center payroll and related employee benefits and service center
occupancy costs. Occupancy costs include utilities, rents, real estate and property taxes, repairs and
maintenance and depreciation and amortization expenses.
CRITICAL ACCOUNTING POLICIES AND ESTIMATES
Management’s Discussion and Analysis of Financial Condition and Results of Operations discusses
the Company’s consolidated financial statements, which have been prepared in accordance with accounting
principles generally accepted in the United States of America. The preparation of these financial
statements requires management to make estimates and assumptions that affect the reported amounts of
assets and liabilities and the disclosure of contingent assets and liabilities at the date of the consolidated
financial statements and the reported amounts of revenues and expenses during the reporting period. On
an on-going basis, management evaluates its estimates and judgments, including those related to customer
incentives, product returns and warranty obligations, bad debts, inventories, income taxes, financing
operations, restructuring costs, retirement benefits, share based compensation, risk participation
agreements and contingencies and litigation. Management bases its estimates and judgments on historical
experience and on various other factors that are believed to be reasonable under the circumstances, the
results of which form the basis for making judgments about the carrying values of assets and liabilities that
are not readily apparent from other sources. Actual results may differ from these estimates under different
assumptions or conditions.