Pep Boys 2006 Annual Report Download - page 52
Download and view the complete annual report
Please find page 52 of the 2006 Pep Boys annual report below. You can navigate through the pages in the report by either clicking on the pages listed below, or by using the keyword search tool below to find specific information within the annual report.-
 1
1 -
2
-
3
-
4
-
5
-
6
-
7
-
8
-
9
-
10
-
11
-
12
-
13
-
14
-
15
-
16
-
17
-
18
-
19
-
20
-
21
-
22
-
23
-
24
-
25
-
26
-
27
-
28
-
29
-
30
-
31
-
32
-
33
-
34
-
35
-
36
-
37
-
38
-
39
-
40
-
41
-
 42
42 -
 43
43 -
 44
44 -
 45
45 -
 46
46 -
 47
47 -
 48
48 -
 49
49 -
 50
50 -
 51
51 -
 52
52 -
 53
53 -
 54
54 -
 55
55 -
 56
56 -
 57
57 -
 58
58 -
 59
59 -
 60
60 -
 61
61 -
 62
62 -
63
-
64
-
65
-
66
-
67
-
68
-
69
-
70
-
71
-
72
-
73
-
74
-
75
-
76
-
77
-
78
-
79
-
80
-
81
-
82
-
83
-
84
-
85
-
86
-
87
-
88
-
89
-
90
-
91
-
92
-
93
-
94
-
95
-
96
-
97
-
98
-
99
-
100
-
101
-
102
-
103
-
104
-
105
-
106
-
107
-
108
-
109
-
110
-
111
-
112
-
113
-
114
-
115
-
116
-
117
-
118
-
119
-
120
-
121
-
122
-
123
-
124
-
125
-
126
-
127
-
128
-
129
-
130
-
131
-
132
-
133
-
134
-
135
-
136
 |
 |

14
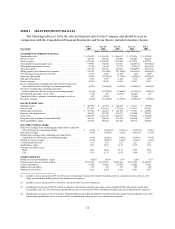
ITEM 6 SELECTED FINANCIAL DATA
The following tables set forth the selected financial data for the Company and should be read in
conjunction with the Consolidated Financial Statements and Notes thereto included elsewhere herein.
Year ended
Feb. 3,
2007
Jan. 28,
2006
Jan. 29,
2005
Jan. 31,
2004
Feb. 1,
2003
(dollar amounts are in thousands, except share data)
STATEMENT OF OPERATIONS DATA(5)
Merchandise sales. . . . . . . . . . . . . . . . . . . . . . . . . . . . . . . . . . . . . $ 1,876,290 $ 1,854,408 $ 1,863,015 $ 1,728,386 $ 1,697,628
Service revenue. . . . . . . . . . . . . . . . . . . . . . . . . . . . . . . . . . . . . . . 395,871 383,621 409,881 405,884 400,149
Totalrevenues ....................................... 2,272,161 2,238,029 2,272,896 2,134,270 2,097,777
Gross profit from merchandise sales. . . . . . . . . . . . . . . . . . . . . . . . 539,954 476,856 517,871 486,087(3) 507,702(4)
Grossprofitfromservicerevenue ......................... 31,802 30,411 92,739 94,762
(3) 100,355(4)
Total gross profit. . . . . . . . . . . . . . . . . . . . . . . . . . . . . . . . . . . . . . 571,756 507,267 610,610 580,849(3) 608,057(4)
Selling, general and administrative expenses. . . . . . . . . . . . . . . . . . 551,031 523,318(1) 547,336(2) 569,834(3) 504,163(4)
NetGain(Loss)fromSalesofAssets(6)..................... 15,297 4,826 11,848 (61) 1,909
Operating (loss) profit. . . . . . . . . . . . . . . . . . . . . . . . . . . . . . . . . . 36,022 (11,225)(1) 75,122(2) 10,954(3) 105,803(4)
Non-operatingincome.................................. 7,023 3,897 1,824 3,340 3,097
Interest expense . . . . . . . . . . . . . . . . . . . . . . . . . . . . . . . . . . . . . . 49,342 49,040 35,965 38,255 47,237
(Loss) earnings from continuing operations before income taxes
and cumulative effect of change in accounting principle. . . . . . . . (6,297) (56,368)(1) 40,981(2) (23,961)(3) 61,267(4)
Net (loss) earnings from continuing operations
before cumulative effect of change in accounting principle. . . . . . (2,000) (35,799)(1) 25,666(2) (15,145)(3) 38,881(4)
Discontinued operations, net of tax(6) . . . . . . . . . . . . . . . . . . . . . . (738) 292 (2,087) (16,265) 587
Cumulative effect of change in accounting principle, net of tax . . . . 189 (2,021) — (2,484) —
Net(loss)earnings .................................... (2,549) (37,528)(1) 23,579(2) (33,894)(3) 39,468(4)
BALANCE SHEET DATA
Working capital . . . . . . . . . . . . . . . . . . . . . . . . . . . . . . . . . . . . . . $ 163,960 $ 247,526 $ 180,651 $ 76,227 $ 130,680
Current ratio. . . . . . . . . . . . . . . . . . . . . . . . . . . . . . . . . . . . . . . . . 1.27 to 1 1.43 to 1 1.27 to 1 1.10 to 1 1.24 to 1
Merchandise inventories . . . . . . . . . . . . . . . . . . . . . . . . . . . . . . . . $ 607,042 $ 616,292 $ 602,760 $ 553,562 $ 488,882
Property and equipment-net . . . . . . . . . . . . . . . . . . . . . . . . . . . . . 906,247 947,389 945,031 923,209 974,673
Totalassets.......................................... 1,767,199 1,821,753 1,867,023 1,778,046 1,741,650
Long-term debt (includes all convertible debt) . . . . . . . . . . . . . . . . 535,031 586,239 471,682 408,016 525,577
Total stockholders’ equity . . . . . . . . . . . . . . . . . . . . . . . . . . . . . . . 567,755 594,565 653,456 569,734 605,880
DATA PER COMMON SHARE
Basic (loss) earnings from continuing operations before cumulative
effectofchangeinaccountingprinciple ................... $ (0.04) $ (0.65)(1)$ 0.46(2) $ (0.29)(3)$ 0.75(4)
Basic(loss)earnings................................... (0.05) (0.69)(1) 0.42(2) (0.65)(3) 0.77(4)
Diluted (loss) earnings from continuing operations before
cumulative effect of change in accounting principle . . . . . . . . . . . (0.04) (0.65)(1) 0.45(2) (0.29)(3) 0.73(4)
Dilutednet(loss)earnings............................... (0.05) (0.69
)(1) 0.41(2) (0.65)(3) 0.74(4)
Cash dividends declared . . . . . . . . . . . . . . . . . . . . . . . . . . . . . . . . 0.27 0.27 0.27 0.27 0.27
Stockholders’equity................................... 10.53 10.97 11.87 10.79 11.73
Common share price range:
High............................................. 16.55 18.80 29.37 23.99 19.38
Low ............................................. 9.33 11.75 11.83 6.00 8.75
OTHER STATISTICS
Returnonaveragestockholders’equity..................... (0.4)% (6.0)% 3.9% (5.8)% 6.7%
Common shares issued and outstanding . . . . . . . . . . . . . . . . . . . . . 53,934,084 54,208,803 55,056,641 52,787,148 51,644,578
Capitalexpenditures................................... 53,903 92,083 103,766 43,262 43,911
Number of retail outlets . . . . . . . . . . . . . . . . . . . . . . . . . . . . . . . . 593 593 595 595 629
Numberofservicebays................................. 6,162 6,162 6,181 6,181 6,527
(1) Includes a pretax charge of $4,200 related to an asset impairment charge reflecting the remaining value of a commercial sales software asset,
which was included in selling, general and administrative expenses.
(2) Includes a pretax charge of $6,911 related to certain executive severance obligations.
(3) Includes pretax charges of $88,980 related to corporate restructuring and other one-time events of which $29,308 reduced gross profit from
merchandise sales, $3,278 reduced gross profit from service revenue and $56,394 was included in selling, general and administrative expenses.
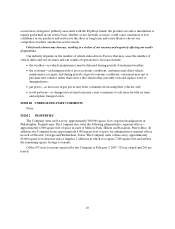
(4) Includes pretax charges of $2,529 related to the Profit Enhancement Plan of which $2,014 reduced the gross profit from merchandise sales, $491
reduced gross profit from service revenue and $24 was included in selling, general and administrative expenses.