Pep Boys 2006 Annual Report Download - page 106
Download and view the complete annual report
Please find page 106 of the 2006 Pep Boys annual report below. You can navigate through the pages in the report by either clicking on the pages listed below, or by using the keyword search tool below to find specific information within the annual report.-
 1
1 -
2
-
3
-
4
-
5
-
6
-
7
-
8
-
9
-
10
-
11
-
12
-
13
-
14
-
15
-
16
-
17
-
18
-
19
-
20
-
21
-
22
-
23
-
24
-
25
-
26
-
27
-
28
-
29
-
30
-
31
-
32
-
33
-
34
-
35
-
36
-
37
-
38
-
39
-
40
-
41
-
42
-
43
-
44
-
45
-
46
-
47
-
48
-
49
-
50
-
51
-
52
-
53
-
54
-
55
-
56
-
57
-
58
-
59
-
60
-
61
-
62
-
63
-
64
-
65
-
66
-
67
-
68
-
69
-
70
-
71
-
72
-
73
-
74
-
75
-
76
-
77
-
78
-
79
-
80
-
81
-
82
-
83
-
84
-
85
-
86
-
87
-
88
-
89
-
90
-
91
-
92
-
93
-
94
-
95
-
 96
96 -
 97
97 -
 98
98 -
 99
99 -
 100
100 -
 101
101 -
 102
102 -
 103
103 -
 104
104 -
 105
105 -
 106
106 -
 107
107 -
 108
108 -
 109
109 -
 110
110 -
 111
111 -
 112
112 -
 113
113 -
 114
114 -
 115
115 -
 116
116 -
117
-
118
-
119
-
120
-
121
-
122
-
123
-
124
-
125
-
126
-
127
-
128
-
129
-
130
-
131
-
132
-
133
-
134
-
135
-
136
 |
 |

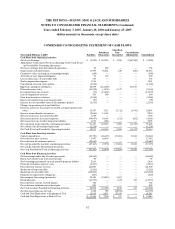
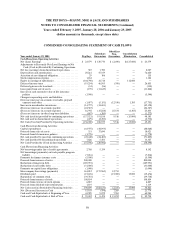
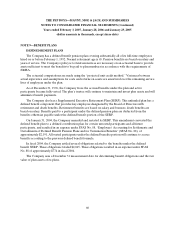
THE PEP BOYS—MANNY, MOE & JACK AND SUBSIDIARIES
NOTES TO CONSOLIDATED FINANCIAL STATEMENTS (Continued)
Years ended February 3, 2007, January 28, 2006 and January 29, 2005
(dollar amounts in thousands, except share data)
67
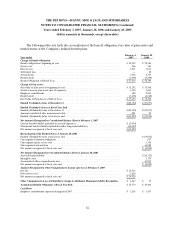
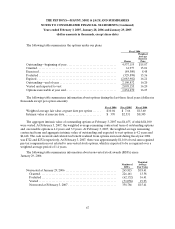
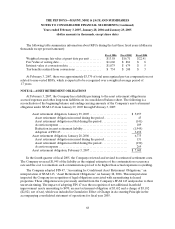
The following table summarizes the options under our plans:
Fiscal 2006
Shares
Weighted
Average
Exercise
Price
Outstanding—beginning of year . . . . . . . . . . . . . . . . . . . . . . . . . . . . . . . . . . . 4,537,155 $15.87
Granted........................................................ 61,977 15.01
Exercised....................................................... (84,500) 8.48
Forfeited....................................................... (329,898) 13.36
Expired ........................................................ (2,083,902) 16.21
Outstanding—end of year . . . . . . . . . . . . . . . . . . . . . . . . . . . . . . . . . . . . . . . . 2,100,832 16.20
Vested and expected to vest 2,095,153 16.20
Options exercisable at year end. . . . . . . . . . . . . . . . . . . . . . . . . . . . . . . . . . . . 1,834,670 16.23
The following table summarizes information about options during the last three fiscal years (dollars in
thousands except per option amount):
Fiscal 2006 Fiscal 2005 Fiscal 2004
Weighted average fair value at grant date per option . . . . . . $10.04 $ 7.66 $13.60
Intrinsic value at exercise date. . . . . . . . . . . . . . . . . . . . . . . . . . $ 370 $2,531 $8,305
The aggregate intrinsic value of outstanding options at February 3, 2007 was $4,455, of which $4,100
were vested. At February 3, 2007, the weighted average remaining contractual term of outstanding options
and exercisable options is 4.2 years and 3.9 years. At February 3, 2007, the weighted average remaining
contractual term and aggregate intrinsic value of outstanding and expected to vest options is 4.2 years and
$4,448. The cash received and related tax benefit realized from options exercised during fiscal year 2006
was $722 and $252 respectively. At February 3, 2007, there was approximately $1,160 of total unrecognized
pre-tax compensation cost related to non-vested stock options, which is expected to be recognized over a
weighted-average period of 1.4 years.
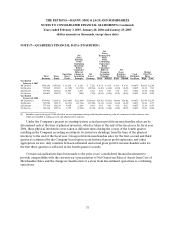
The following table summarizes information about non-vested stock awards (RSUs) since
January 29, 2006:
Number of
RSUs
Weighted
Average
Fair Value
NonvestedatJanuary29,2006 .................................... 265,815 $18.41
Granted...................................................... 226,161 13.58
Forfeited..................................................... (62,132) 16.41
Vested....................................................... (71,058) 19.93
NonvestedatFebruary3,2007.................................. 358,786 $15.41