Pep Boys 2006 Annual Report Download - page 96
Download and view the complete annual report
Please find page 96 of the 2006 Pep Boys annual report below. You can navigate through the pages in the report by either clicking on the pages listed below, or by using the keyword search tool below to find specific information within the annual report.-
 1
1 -
2
-
3
-
4
-
5
-
6
-
7
-
8
-
9
-
10
-
11
-
12
-
13
-
14
-
15
-
16
-
17
-
18
-
19
-
20
-
21
-
22
-
23
-
24
-
25
-
26
-
27
-
28
-
29
-
30
-
31
-
32
-
33
-
34
-
35
-
36
-
37
-
38
-
39
-
40
-
41
-
42
-
43
-
44
-
45
-
46
-
47
-
48
-
49
-
50
-
51
-
52
-
53
-
54
-
55
-
56
-
57
-
58
-
59
-
60
-
61
-
62
-
63
-
64
-
65
-
66
-
67
-
68
-
69
-
70
-
71
-
72
-
73
-
74
-
75
-
76
-
77
-
78
-
79
-
80
-
81
-
82
-
83
-
84
-
85
-
 86
86 -
 87
87 -
 88
88 -
 89
89 -
 90
90 -
 91
91 -
 92
92 -
 93
93 -
 94
94 -
 95
95 -
 96
96 -
 97
97 -
 98
98 -
 99
99 -
 100
100 -
 101
101 -
 102
102 -
 103
103 -
 104
104 -
 105
105 -
 106
106 -
107
-
108
-
109
-
110
-
111
-
112
-
113
-
114
-
115
-
116
-
117
-
118
-
119
-
120
-
121
-
122
-
123
-
124
-
125
-
126
-
127
-
128
-
129
-
130
-
131
-
132
-
133
-
134
-
135
-
136
 |
 |

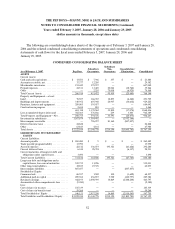
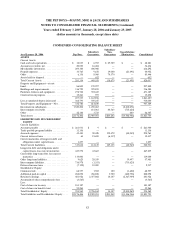
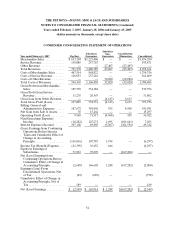
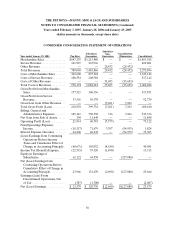
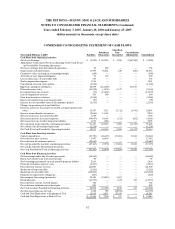
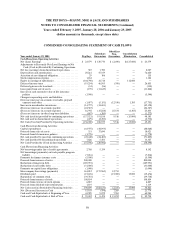
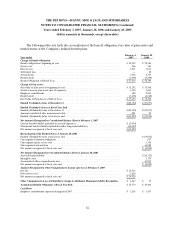
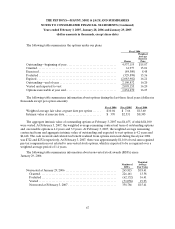
THE PEP BOYS—MANNY, MOE & JACK AND SUBSIDIARIES
NOTES TO CONSOLIDATED FINANCIAL STATEMENTS (Continued)
Years ended February 3, 2007, January 28, 2006 and January 29, 2005
(dollar amounts in thousands, except share data)
57
CONDENSED CONSOLIDATING STATEMENT OF CASH FLOWS
Year ended February 3, 2007 Pep Boys
Subsidiary
Guarantors
Subsidiary
Non-
Guarantors
Consolidation
Elimination Consolidated
Cash Flows from Operating Activities:
Net(Loss)Earnings................................... $ (2,549) $ 165,914 $ 1,288 $(167,202) $ (2,549)
Adjustments to Reconcile Net (Loss) Earnings to Net Cash (Used
in) Provided By Continuing Operations:
Netloss(earnings)fromdiscontinuedoperations............. 49 689 — — 738
Depreciationandamortization........................... 31,795 56,681 240 (240) 88,476
Cumulativeeffectofchangeinaccountingprinciple........... (189) — — — (189)
Accretionofassetdisposalobligation...................... 95 174 — — 269
Lossondefeasanceofconvertibledebt..................... 755 — — — 755
Stock compensation expense. . . . . . . . . . . . . . . . . . . . . . . . . . . . . 3,051 — — — 3,051
Cancellationofvestedstockoptions....................... (1,056) — — — (1,056)
Equityinearningsofsubsidiaries......................... 28,039 (163,669) — 135,630 —
Deferredincometaxes................................. (11,598) (3,055) 6,337 — (8,316)
Loss (gain) from sale of assets. . . . . . . . . . . . . . . . . . . . . . . . . . . . (35) (15,262) — — (15,297)
Loss on impairment of assets . . . . . . . . . . . . . . . . . . . . . . . . . . . . 550 290 — — 840
Gain from derivative valuation . . . . . . . . . . . . . . . . . . . . . . . . . . . (5,568) — — — (5,568)
Excess tax benefits from stock based awards . . . . . . . . . . . . . . . . . (95) — — — (95)
Increase in cash surrender value of life insurance policies . . . . . . . (2,143) — — — (2,143)
Changes in operating assets and liabilities:
Decrease (increase) in accounts receivable, prepaid expenses and
other............................................. 24,587 7,113 (5,712) (1,943) 24,045
Increase in merchandise inventories . . . . . . . . . . . . . . . . . . . . . . . (2,061) 11,311 — — 9,250
(Decrease) increase in accounts payable . . . . . . . . . . . . . . . . . . . . 3,549 — — — 3,549
(Decrease) increase in accrued expenses. . . . . . . . . . . . . . . . . . . . (49,057) 45,645 (151) (602) (4,165)
(Decrease) increase in other long-term liabilities. . . . . . . . . . . . . . 3,074 (981) — — 2,093
Net cash (used in) provided by continuing operations . . . . . . . . . . 21,193 104,850 2,002 (34,357) 93,688
Netcashusedindiscontinuedoperations................... (1,258) — — — (1,258)
Net Cash (Used in) Provided by Operating Activities . . . . . . . . . . 19,935 104,850 2,002 (34,357) 92,430
Cash Flows from Investing Activities:
Capitalexpenditures................................... (23,793) (26,419) (33,830) 33,830 (50,212)
Proceedsfromsalesofassets............................. 1,097 16,445 — — 17,542
Proceedsfromlifeinsurancepolicies....................... (24,669) — — — (24,669)
Net cash provided by (used in) continuing operations . . . . . . . . . . (47,365) (9,974) (33,830) 33,830 (57,339)
Netcashprovidedbydiscontinuedoperations................ — — — — —
Net Cash Provided by (Used in) Investing Activities . . . . . . . . . . . (47,365) (9,974) (33,830) 33,830 (57,339)
Cash Flows from Financing Activities:
Net borrowings under line of credit agreements . . . . . . . . . . . . . . (48,569) — — — (48,569)
Excess tax benefits from stock based awards . . . . . . . . . . . . . . . . . 95 — — — 95
Net borrowings (payments) on trade payable program liability . . . 2,834 — — — 2,834
Paymentsforfinanceissuancecosts ....................... (2,217) — — — (2,217)
Proceedsfromissuanceofnotes.......................... 121,000 — — — 121,000
Reductionoflong-termdebt............................. (2,263) — — — (2,263)
Reduction of convertible debt. . . . . . . . . . . . . . . . . . . . . . . . . . . . (119,000) — — — (119,000)
Paymentsoncapitalleaseobligations...................... (227) — — — (227)
Intercompanyborrowings(payments)...................... 90,480 (93,883) 3,403 — —
Dividendspaid....................................... (14,757) — (527) 527 (14,757)
Proceedsfromexerciseofstockoptions .................... 722 — — — 722
Proceedsfromdividendreinvestmentplan.................. 894 — — — 894
Net Cash (used in) Provided by Financing Activities . . . . . . . . . . . 28,992 (93,883) 2,876 527 (61,488)
Net (Decrease) Increase in Cash. . . . . . . . . . . . . . . . . . . . . . . . . . 1,562 993 (28,952) — (26,397)
Cash and Cash Equivalents at Beginning of Year . . . . . . . . . . . . . 12,019 6,953 29,309 — 48,281
CashandCashEquivalentsatEndofYear.................. $ 13,581 $ 7,946 $ 357 $ — $ 21,884