Pep Boys 2006 Annual Report Download - page 92
Download and view the complete annual report
Please find page 92 of the 2006 Pep Boys annual report below. You can navigate through the pages in the report by either clicking on the pages listed below, or by using the keyword search tool below to find specific information within the annual report.-
 1
1 -
2
-
3
-
4
-
5
-
6
-
7
-
8
-
9
-
10
-
11
-
12
-
13
-
14
-
15
-
16
-
17
-
18
-
19
-
20
-
21
-
22
-
23
-
24
-
25
-
26
-
27
-
28
-
29
-
30
-
31
-
32
-
33
-
34
-
35
-
36
-
37
-
38
-
39
-
40
-
41
-
42
-
43
-
44
-
45
-
46
-
47
-
48
-
49
-
50
-
51
-
52
-
53
-
54
-
55
-
56
-
57
-
58
-
59
-
60
-
61
-
62
-
63
-
64
-
65
-
66
-
67
-
68
-
69
-
70
-
71
-
72
-
73
-
74
-
75
-
76
-
77
-
78
-
79
-
80
-
81
-
 82
82 -
 83
83 -
 84
84 -
 85
85 -
 86
86 -
 87
87 -
 88
88 -
 89
89 -
 90
90 -
 91
91 -
 92
92 -
 93
93 -
 94
94 -
 95
95 -
 96
96 -
 97
97 -
 98
98 -
 99
99 -
 100
100 -
 101
101 -
 102
102 -
103
-
104
-
105
-
106
-
107
-
108
-
109
-
110
-
111
-
112
-
113
-
114
-
115
-
116
-
117
-
118
-
119
-
120
-
121
-
122
-
123
-
124
-
125
-
126
-
127
-
128
-
129
-
130
-
131
-
132
-
133
-
134
-
135
-
136
 |
 |

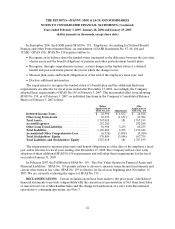
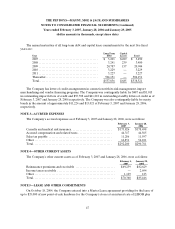
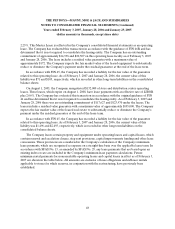
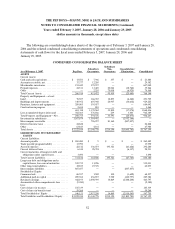
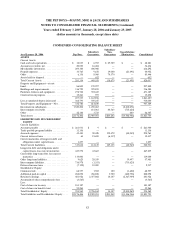
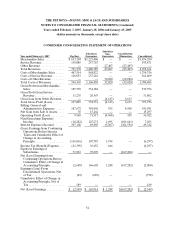
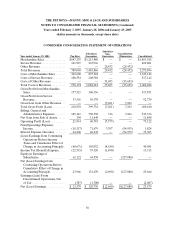
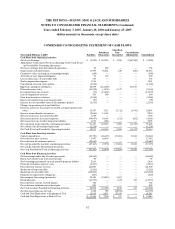
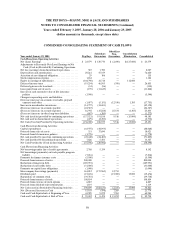
THE PEP BOYS—MANNY, MOE & JACK AND SUBSIDIARIES
NOTES TO CONSOLIDATED FINANCIAL STATEMENTS (Continued)
Years ended February 3, 2007, January 28, 2006 and January 29, 2005
(dollar amounts in thousands, except share data)
53
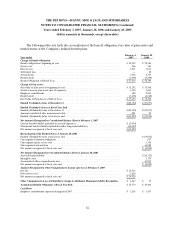
CONDENSED CONSOLIDATING BALANCE SHEET
As of January 28, 2006 Pep Boys
Subsidiary
Guarantors
Subsidiary
Non-
Guarantors
Consolidation /
Elimination Consolidated
ASSETS
Current Assets:
Cashandcashequivalents................. $ 12,019 $ 6,953 $ 29,309 $ — $ 48,281
Accountsreceivable,net.................. 20,030 16,404 — — 36,434
Merchandiseinventories.................. 209,384 406,908 — — 616,292
Prepaidexpenses........................ 33,765 9,678 19,000 (21,491) 40,952
Other . ............................... 6,116 8,960 70,370 — 85,446
Assetsheldfordisposal................... — 652 — — 652
TotalCurrentAssets..................... 281,314 449,555 118,679 (21,491) 828,057
Property and Equipment—at cost:
Land................................. 86,805 170,997 — — 257,802
Buildingsandimprovements............... 316,725 599,855 — — 916,580
Furniture,fixturesandequipment .......... 278,742 392,447 — — 671,189
Constructioninprogress.................. 15,261 597 — — 15,858
697,533 1,163,896 — — 1,861,429
Lessaccumulateddepreciationand ......... 364,793 549,247 — — 914,040
TotalPropertyandEquipment—Net........ 332,740 614,649 — — 947,389
Investmentinsubsidiaries................. 1,520,208 1,290,063 — (2,810,271) —
Intercompanyreceivable.................. — 631,061 84,563 (715,624) —
Other . ............................... 42,144 3,723 — 440 46,307
TotalAssets ........................... $2,176,406 $2,989,051 $203,242 $(3,546,946) $1,821,753
LIABILITIES AND STOCKHOLDERS’
EQUITY
Current Liabilities:
Accountspayable....................... $ 261,931 $ 9 $ — $ — $ 261,940
Tradepayableprogramliability ............ 11,156 — 11,156
Accruedexpenses....................... 45,410 90,428 195,472 (40,549) 290,761
Currentdeferredtaxes................... 64 21,690 (6,337) — 15,417
Current maturities of long-term debt and
obligations under capital leases. . ......... 1,257 — — — 1,257
TotalCurrentLiabilities.................. 319,818 112,127 189,135 (40,549) 580,531
Long-term debt and obligations under
capital leases, less current maturities . . . . . . 423,572 43,667 — — 467,239
Convertible long-term debt, less current
maturities ........................... 119,000 — — — 119,000
Other long-term liabilities. . ............... 9,625 28,359 — 19,497 57,481
Intercompanyliabilities................... 716,978 (1,353) — (715,625) —
Deferredincometaxes................... (7,152) 10,089 — — 2,937
Stockholders’ Equity:
Commonstock......................... 68,557 1,502 100 (1,602) 68,557
Additionalpaid-incapital................. 288,098 436,858 3,900 (440,758) 288,098
Retainedearnings....................... 481,926 2,357,802 10,107 (2,367,909) 481,926
Accumulated other comprehensive loss . . . . . . (3,565) — — — (3,565)
Less:
Costofsharesintreasury................. 181,187 — — — 181,187
Costofsharesinbenefitstrust............. 59,264 — — — 59,264
TotalStockholders’Equity................ 594,565 2,796,162 14,107 (2,810,269) 594,565
Total Liabilities and Stockholders’ Equity . . . . $2,176,406 $2,989,051 $203,242 $(3,546,946) $1,821,753