Pep Boys 2006 Annual Report Download - page 104
Download and view the complete annual report
Please find page 104 of the 2006 Pep Boys annual report below. You can navigate through the pages in the report by either clicking on the pages listed below, or by using the keyword search tool below to find specific information within the annual report.-
 1
1 -
2
-
3
-
4
-
5
-
6
-
7
-
8
-
9
-
10
-
11
-
12
-
13
-
14
-
15
-
16
-
17
-
18
-
19
-
20
-
21
-
22
-
23
-
24
-
25
-
26
-
27
-
28
-
29
-
30
-
31
-
32
-
33
-
34
-
35
-
36
-
37
-
38
-
39
-
40
-
41
-
42
-
43
-
44
-
45
-
46
-
47
-
48
-
49
-
50
-
51
-
52
-
53
-
54
-
55
-
56
-
57
-
58
-
59
-
60
-
61
-
62
-
63
-
64
-
65
-
66
-
67
-
68
-
69
-
70
-
71
-
72
-
73
-
74
-
75
-
76
-
77
-
78
-
79
-
80
-
81
-
82
-
83
-
84
-
85
-
86
-
87
-
88
-
89
-
90
-
91
-
92
-
93
-
 94
94 -
 95
95 -
 96
96 -
 97
97 -
 98
98 -
 99
99 -
 100
100 -
 101
101 -
 102
102 -
 103
103 -
 104
104 -
 105
105 -
 106
106 -
 107
107 -
 108
108 -
 109
109 -
 110
110 -
 111
111 -
 112
112 -
 113
113 -
 114
114 -
115
-
116
-
117
-
118
-
119
-
120
-
121
-
122
-
123
-
124
-
125
-
126
-
127
-
128
-
129
-
130
-
131
-
132
-
133
-
134
-
135
-
136
 |
 |

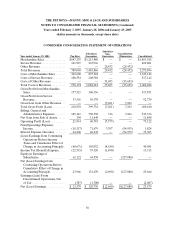
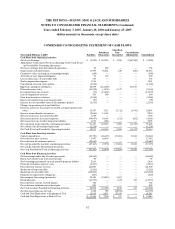
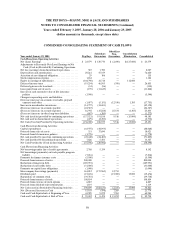
THE PEP BOYS—MANNY, MOE & JACK AND SUBSIDIARIES
NOTES TO CONSOLIDATED FINANCIAL STATEMENTS (Continued)
Years ended February 3, 2007, January 28, 2006 and January 29, 2005
(dollar amounts in thousands, except share data)
65
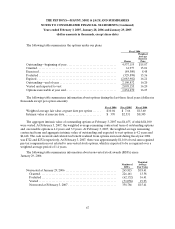
NOTE 10—NET EARNINGS PER SHARE
For fiscal years 2006, 2005 and 2004, basic earnings per share are based on net earnings divided by the
weighted average number of shares outstanding during the period. Diluted earnings per share assumes the
dilutive effects of the conversion of convertible senior notes and the exercising of stock options.
Adjustments for the stock options were anti-dilutive in fiscal 2006 and 2005 and therefore excluded from
the calculation due to the Company’s net loss for the year. Additionally, adjustments for the convertible
senior notes and purchase rights were anti-dilutive in all periods presented.
The following schedule presents the calculation of basic and diluted earnings per share for net (loss)
earnings from continuing operations:
Year ended
February 3,
2007
January 28,
2006
January 29,
2005
(a) Net (loss) earnings from continuing operations before
cumulative effect of change in accounting principle . . . . . . . . . . . . $ (2,000) $(35,799) $25,666
Adjustment for interest on convertible senior notes, net of
incometaxeffect.......................................... — — —
(b) Adjusted net (loss) earnings from continuing operations. . . . . . . $ (2,000) $(35,799) $25,666
(c) Average number of common shares outstanding during period . 54,318 54,831 56,361
Common shares assumed issued upon conversion of convertible
seniornotes............................................... — — —
Common shares assumed issued upon exercise of dilutive stock
options, net of assumed repurchase, at the average market price . — — 1,296
(d) Average number of common shares assumed outstanding
duringperiod ............................................. 54,318 54,831 57,657
Basic (Loss) Earnings Per Share:
Net (Loss) Earnings From Continuing Operations Before
Cumulative Effect of Change in Accounting Principle (a/c) . . . $ (0.04) $ (0.65) $ 0.46
LossfromDiscontinuedOperations,NetofTax............... (0.01) — (0.04)
Cumulative Effect of Change in Accounting Principle, Net of
Tax.................................................... — (0.04) —
Basic (Loss) Earnings Per Share . . . . . . . . . . . . . . . . . . . . . . . . . . . . . . . $ (0.05) $ (0.69) $ 0.42
Diluted (Loss) Earnings Per Share:
Net (Loss) Earnings From Continuing Operations Before
Cumulative Effect of Change in Accounting Principle (b/d) . . . $ (0.04) $ (0.65) $ 0.45
DiscontinuedOperations,NetofTax......................... (0.01) — (0.04)
Cumulative Effect of Change in Accounting Principle, Net of Tax. . — (0.04) —
Diluted (Loss) Earnings Per Share . . . . . . . . . . . . . . . . . . . . . . . . . . . . . $ (0.05) $ (0.69) $ 0.41