Pep Boys 2006 Annual Report Download - page 72
Download and view the complete annual report
Please find page 72 of the 2006 Pep Boys annual report below. You can navigate through the pages in the report by either clicking on the pages listed below, or by using the keyword search tool below to find specific information within the annual report.-
 1
1 -
2
-
3
-
4
-
5
-
6
-
7
-
8
-
9
-
10
-
11
-
12
-
13
-
14
-
15
-
16
-
17
-
18
-
19
-
20
-
21
-
22
-
23
-
24
-
25
-
26
-
27
-
28
-
29
-
30
-
31
-
32
-
33
-
34
-
35
-
36
-
37
-
38
-
39
-
40
-
41
-
42
-
43
-
44
-
45
-
46
-
47
-
48
-
49
-
50
-
51
-
52
-
53
-
54
-
55
-
56
-
57
-
58
-
59
-
60
-
61
-
 62
62 -
 63
63 -
 64
64 -
 65
65 -
 66
66 -
 67
67 -
 68
68 -
 69
69 -
 70
70 -
 71
71 -
 72
72 -
 73
73 -
 74
74 -
 75
75 -
 76
76 -
 77
77 -
 78
78 -
 79
79 -
 80
80 -
 81
81 -
 82
82 -
83
-
84
-
85
-
86
-
87
-
88
-
89
-
90
-
91
-
92
-
93
-
94
-
95
-
96
-
97
-
98
-
99
-
100
-
101
-
102
-
103
-
104
-
105
-
106
-
107
-
108
-
109
-
110
-
111
-
112
-
113
-
114
-
115
-
116
-
117
-
118
-
119
-
120
-
121
-
122
-
123
-
124
-
125
-
126
-
127
-
128
-
129
-
130
-
131
-
132
-
133
-
134
-
135
-
136
 |
 |

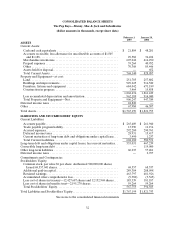
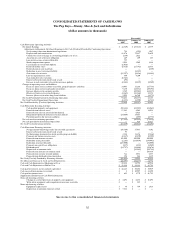
See notes to the consolidated financial statements
33
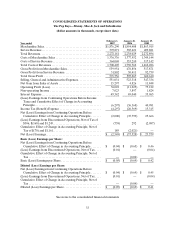
CONSOLIDATED STATEMENTS OF OPERATIONS
The Pep Boys—Manny, Moe & Jack and Subsidiaries
(dollar amounts in thousands, except share data)
February 3, January 28, January 29,
Year ended 2007 2006 2005
Merchandise Sales . . . . . . . . . . . . . . . . . . . . . . . . . . . . . . . . . . . . . . . . $1,876,290 $1,854,408 $1,863,015
Service Revenue. . . . . . . . . . . . . . . . . . . . . . . . . . . . . . . . . . . . . . . . . . 395,871 383,621 409,881
Total Revenues. . . . . . . . . . . . . . . . . . . . . . . . . . . . . . . . . . . . . . . . . . . 2,272,161 2,238,029 2,272,896
Costs of Merchandise Sales . . . . . . . . . . . . . . . . . . . . . . . . . . . . . . . . 1,336,336 1,377,552 1,345,144
Costs of Service Revenue . . . . . . . . . . . . . . . . . . . . . . . . . . . . . . . . . . 364,069 353,210 317,142
Total Costs of Revenues . . . . . . . . . . . . . . . . . . . . . . . . . . . . . . . . . . . 1,700,405 1,730,762 1,662,286
Gross Profit from Merchandise Sales. . . . . . . . . . . . . . . . . . . . . . . . 539,954 476,856 517,871
GrossProfitfromServiceRevenue.......................... 31,802 30,411 92,739
Total Gross Profit . . . . . . . . . . . . . . . . . . . . . . . . . . . . . . . . . . . . . . . . 571,756 507,267 610,610
Selling, General and Administrative Expenses . . . . . . . . . . . . . . . . 551,031 523,318 547,336
NetGainfromSalesofAssets.............................. 15,297 4,826 11,848
OperatingProfit(Loss).................................... 36,022 (11,225) 75,122
Non-operatingIncome.................................... 7,023 3,897 1,824
InterestExpense.......................................... 49,342 49,040 35,965
(Loss) Earnings from Continuing Operations Before Income
Taxes and Cumulative Effect of Change in Accounting
Principle............................................... (6,297) (56,368) 40,981
IncomeTax(Benefit)Expense ............................. (4,297) (20,569) 15,315
Net (Loss) Earnings from Continuing Operations Before
Cumulative Effect of Change in Accounting Principle . . . . . . . (2,000) (35,799) 25,666
(Loss) Earnings from Discontinued Operations, Net of Tax of
$306, $(168) and $1,245. . . . . . . . . . . . . . . . . . . . . . . . . . . . . . . . . . (738) 292 (2,087)
Cumulative Effect of Change in Accounting Principle, Net of
Taxof$(78)and$1,161.................................. 189 (2,021) —
Net(Loss)Earnings....................................... $ (2,549) $ (37,528) $ 23,579
Basic (Loss) Earnings per Share:
Net (Loss) Earnings from Continuing Operations Before
Cumulative Effect of Change in Accounting Principle . . . . . . . $ (0.04) $ (0.65) $ 0.46
(Loss) Earnings from Discontinued Operations, Net of Tax . . . . (0.01) — (0.04)
Cumulative Effect of Change in Accounting Principle, Net of
Tax................................................... — (0.04) —
Basic (Loss) Earnings per Share . . . . . . . . . . . . . . . . . . . . . . . . . . . . $ (0.05) $ (0.69) $ 0.42
Diluted (Loss) Earnings per Share:
Net (Loss) Earnings from Continuing Operations Before
Cumulative Effect of Change in Accounting Principle . . . . . . . $ (0.04) $ (0.65) $ 0.45
(Loss) Earnings from Discontinued Operations, Net of Tax . . . . (0.01) — (0.04)
Cumulative Effect of Change in Accounting Principle, Net of
Tax................................................... — (0.04) —
Diluted(Loss)EarningsperShare.......................... $ (0.05) $ (0.69) $ 0.41