Pep Boys 2006 Annual Report Download - page 94
Download and view the complete annual report
Please find page 94 of the 2006 Pep Boys annual report below. You can navigate through the pages in the report by either clicking on the pages listed below, or by using the keyword search tool below to find specific information within the annual report.-
 1
1 -
2
-
3
-
4
-
5
-
6
-
7
-
8
-
9
-
10
-
11
-
12
-
13
-
14
-
15
-
16
-
17
-
18
-
19
-
20
-
21
-
22
-
23
-
24
-
25
-
26
-
27
-
28
-
29
-
30
-
31
-
32
-
33
-
34
-
35
-
36
-
37
-
38
-
39
-
40
-
41
-
42
-
43
-
44
-
45
-
46
-
47
-
48
-
49
-
50
-
51
-
52
-
53
-
54
-
55
-
56
-
57
-
58
-
59
-
60
-
61
-
62
-
63
-
64
-
65
-
66
-
67
-
68
-
69
-
70
-
71
-
72
-
73
-
74
-
75
-
76
-
77
-
78
-
79
-
80
-
81
-
82
-
83
-
 84
84 -
 85
85 -
 86
86 -
 87
87 -
 88
88 -
 89
89 -
 90
90 -
 91
91 -
 92
92 -
 93
93 -
 94
94 -
 95
95 -
 96
96 -
 97
97 -
 98
98 -
 99
99 -
 100
100 -
 101
101 -
 102
102 -
 103
103 -
 104
104 -
105
-
106
-
107
-
108
-
109
-
110
-
111
-
112
-
113
-
114
-
115
-
116
-
117
-
118
-
119
-
120
-
121
-
122
-
123
-
124
-
125
-
126
-
127
-
128
-
129
-
130
-
131
-
132
-
133
-
134
-
135
-
136
 |
 |

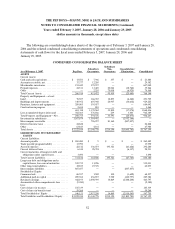
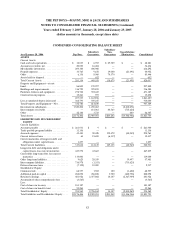
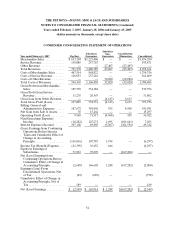
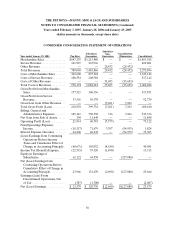
THE PEP BOYS—MANNY, MOE & JACK AND SUBSIDIARIES
NOTES TO CONSOLIDATED FINANCIAL STATEMENTS (Continued)
Years ended February 3, 2007, January 28, 2006 and January 29, 2005
(dollar amounts in thousands, except share data)
55
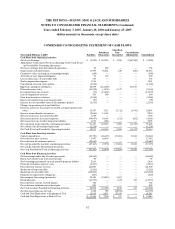
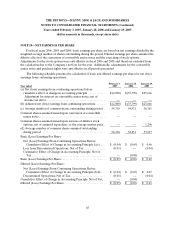
CONDENSED CONSOLIDATING STATEMENT OF OPERATIONS
Year ended January 28, 2006 Pep Boys
Subsidiary
Guarantors
Subsidiary
Non-
Guarantors
Consolidation /
Elimination Consolidated
Merchandise Sales . . . . . . . . . . . . . . $ 643,353 $1,211,055 $ — $ — $1,854,408
Service Revenue. . . . . . . . . . . . . . . . 132,281 251,340 — — 383,621
OtherRevenue................. — — 29,500 (29,500) —
Total Revenues. . . . . . . . . . . . . . . . . 775,634 1,462,395 29,500 (29,500) 2,238,029
Costs of Merchandise Sales . . . . . . 474,965 902,587 — — 1,377,552
Costs of Service Revenue . . . . . . . . 120,320 232,890 — — 353,210
CostsofOtherRevenue......... — — 34,188 (34,188) —
Total Costs of Revenues . . . . . . . . . 595,285 1,135,477 34,188 (34,188) 1,730,762
Gross Profit from Merchandise
Sales........................ 168,388 308,468 — — 476,856
Gross Profit from Service
Revenue..................... 11,961 18,450 — — 30,411
Gross Loss from Other Revenue. . — — (4,688) 4,688 —
Total Gross Profit (Loss) . . . . . . . . 180,349 326,918 (4,688) 4,688 507,267
Selling, General and
Administrative Expenses . . . . . . 176,812 341,491 327 4,688 523,318
Net (Loss) Gain from Sale of
Assets . . . . . . . . . . . . . . . . . . . . . . . (675) 5,501 — — 4,826
Operating Profit (Loss). . . . . . . . . . 2,862 (9,072) (5,015) — (11,225)
Non(Operating (Expense)
Income. . . . . . . . . . . . . . . . . . . . . . (18,682) 92,005 575 (70,001) 3,897
Interest Expense (Income). . . . . . . 88,928 33,987 (3,874) (70,001) 49,040
(Loss) Earnings from Continuing
Operations Before Income
Taxes and Cumulative Effect of
Change in Accounting
Principle. . . . . . . . . . . . . . . . . . . . . (104,748) 48,946 (566) — (56,368)
Income Tax (Benefit) Expense . . . (36,957) 16,600 (212) (20,569)
Equity in Earnings of
Subsidiaries . . . . . . . . . . . . . . . . . . 30,793 64,018 — (94,811) —
Net (Loss) Earnings from
Continuing Operations Before
Cumulative Effect of Change in
Accounting Principle. . . . . . . . . . (36,998) 96,364 (354) (94,811) (35,799)
Earnings (Loss) From
Discontinued Operations, Net
ofTax....................... 324 (32) — — 292
Cumulative Effect of Change in
Accounting Principle, Net of
Tax . . . . . . . . . . . . . . . . . . . . . . . . . (854) (1,167) — — (2,021)
Net (Loss) Earnings. . . . . . . . . . . . . $ (37,528) $ 95,165 $ (354) $(94,811) $ (37,528)