Pep Boys 2006 Annual Report Download - page 112
Download and view the complete annual report
Please find page 112 of the 2006 Pep Boys annual report below. You can navigate through the pages in the report by either clicking on the pages listed below, or by using the keyword search tool below to find specific information within the annual report.-
 1
1 -
2
-
3
-
4
-
5
-
6
-
7
-
8
-
9
-
10
-
11
-
12
-
13
-
14
-
15
-
16
-
17
-
18
-
19
-
20
-
21
-
22
-
23
-
24
-
25
-
26
-
27
-
28
-
29
-
30
-
31
-
32
-
33
-
34
-
35
-
36
-
37
-
38
-
39
-
40
-
41
-
42
-
43
-
44
-
45
-
46
-
47
-
48
-
49
-
50
-
51
-
52
-
53
-
54
-
55
-
56
-
57
-
58
-
59
-
60
-
61
-
62
-
63
-
64
-
65
-
66
-
67
-
68
-
69
-
70
-
71
-
72
-
73
-
74
-
75
-
76
-
77
-
78
-
79
-
80
-
81
-
82
-
83
-
84
-
85
-
86
-
87
-
88
-
89
-
90
-
91
-
92
-
93
-
94
-
95
-
96
-
97
-
98
-
99
-
100
-
101
-
 102
102 -
 103
103 -
 104
104 -
 105
105 -
 106
106 -
 107
107 -
 108
108 -
 109
109 -
 110
110 -
 111
111 -
 112
112 -
 113
113 -
 114
114 -
 115
115 -
 116
116 -
 117
117 -
 118
118 -
 119
119 -
 120
120 -
 121
121 -
 122
122 -
123
-
124
-
125
-
126
-
127
-
128
-
129
-
130
-
131
-
132
-
133
-
134
-
135
-
136
 |
 |

THE PEP BOYS—MANNY, MOE & JACK AND SUBSIDIARIES
NOTES TO CONSOLIDATED FINANCIAL STATEMENTS (Continued)
Years ended February 3, 2007, January 28, 2006 and January 29, 2005
(dollar amounts in thousands, except share data)
73
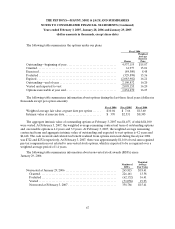
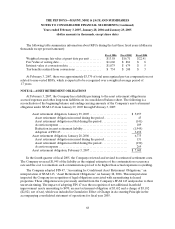
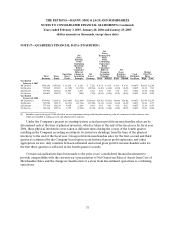
NOTE 17—QUARTERLY FINANCIAL DATA (UNAUDITED)
Total Gross
Operating
(Loss)
Net
(Loss)
Earnings
From
Continuing
Operations
Before
Cumulative
Effect of
Change in
Accounting
Net
(Loss)
Net
(Loss)
Earnings Per
Share
From
Continuing
Operations
Before
Cumulative
Effect of
Change in
Accounting
Principle
Net
(Loss)
Earnings
Per Share
Cash
Dividends
Market
Price Per
Share
Revenues Profit Profit Principle Earnings Basic Diluted Basic Diluted Per Share High Low
Year Ended
February 3, 2007
4th Quarter. . . . . . . $586,146 $150,083 $ 18,140 $ 8,110 $ 7,716 $ 0.15 $ 0.15 $ 0.14 $ 0.14 $0.0675 $16.05 $12.48
3rd Quarter . . . . . . 550,849 137,693 (1,349) (10,713) (10,914) (0.20) (0.20) (0.20) (0.20) 0.0675 14.58 9.33
2nd Quarter . . . . . . 578,565 145,102 11,989 1,470 1,352 0.03 0.03 0.03 0.03 0.0675 14.96 10.66
1st Quarter . . . . . . . 556,601 138,878 7,242 (867) (703) (0.02) (0.02) (0.01) (0.01) 0.0675 16.55 14.05
Year Ended
January 28, 2006
4th Quarter(1) . . . . $550,481 $110,412 $(15,690) $(22,869) $(24,601) $(0.42) $(0.42) $(0.46) $(0.46) $0.0675 $15.99 $12.54
3rd Quarter . . . . . . 545,904 119,113 (8,553) (11,376) (11,196) (0.21) (0.21) (0.20) (0.20) 0.0675 14.84 11.75
2nd Quarter . . . . . . 577,418 138,228 9,659 2,264 1,043 0.01 0.01 0.02 0.02 0.0675 15.24 12.54
1st Quarter . . . . . . . 564,226 139,514 3,359 (3,818) (2,774) (0.04) (0.04) (0.05) (0.05) 0.0675 18.80 14.06
(1) Includes a pretax charge of $4,200 related to an asset impairment charge reflecting the remaining value of a commercial sales software asset,
which was included in selling, general and administrative expenses.
Under the Company’s present accounting system, actual gross profit from merchandise sales can be
determined only at the time of physical inventory, which is taken at the end of the fiscal year. In fiscal year
2006, these physical inventories were taken at different times during the course of the fourth quarter
resulting in the Company recording an estimate for inventory shrinkage from the time of the physical
inventory to the end of the fiscal year. Gross profit from merchandise sales for the first, second and third
quarters is estimated by the Company based upon recent historical gross profit experience and other
appropriate factors. Any variation between estimated and actual gross profit from merchandise sales for
the first three quarters is reflected in the fourth quarter’s results.
Certain reclassifications have been made to the prior years’ consolidated financial statements to
provide comparability with the current year’s presentation of Net Gain from Sales of Assets from Cost of
Merchandise Sales and the change in classification of a store from discontinued operations to continuing
operations.