Pep Boys 2006 Annual Report Download - page 111
Download and view the complete annual report
Please find page 111 of the 2006 Pep Boys annual report below. You can navigate through the pages in the report by either clicking on the pages listed below, or by using the keyword search tool below to find specific information within the annual report.-
 1
1 -
2
-
3
-
4
-
5
-
6
-
7
-
8
-
9
-
10
-
11
-
12
-
13
-
14
-
15
-
16
-
17
-
18
-
19
-
20
-
21
-
22
-
23
-
24
-
25
-
26
-
27
-
28
-
29
-
30
-
31
-
32
-
33
-
34
-
35
-
36
-
37
-
38
-
39
-
40
-
41
-
42
-
43
-
44
-
45
-
46
-
47
-
48
-
49
-
50
-
51
-
52
-
53
-
54
-
55
-
56
-
57
-
58
-
59
-
60
-
61
-
62
-
63
-
64
-
65
-
66
-
67
-
68
-
69
-
70
-
71
-
72
-
73
-
74
-
75
-
76
-
77
-
78
-
79
-
80
-
81
-
82
-
83
-
84
-
85
-
86
-
87
-
88
-
89
-
90
-
91
-
92
-
93
-
94
-
95
-
96
-
97
-
98
-
99
-
100
-
 101
101 -
 102
102 -
 103
103 -
 104
104 -
 105
105 -
 106
106 -
 107
107 -
 108
108 -
 109
109 -
 110
110 -
 111
111 -
 112
112 -
 113
113 -
 114
114 -
 115
115 -
 116
116 -
 117
117 -
 118
118 -
 119
119 -
 120
120 -
 121
121 -
122
-
123
-
124
-
125
-
126
-
127
-
128
-
129
-
130
-
131
-
132
-
133
-
134
-
135
-
136
 |
 |

THE PEP BOYS—MANNY, MOE & JACK AND SUBSIDIARIES
NOTES TO CONSOLIDATED FINANCIAL STATEMENTS (Continued)
Years ended February 3, 2007, January 28, 2006 and January 29, 2005
(dollar amounts in thousands, except share data)
72
Expense. The Company intends to meet the documentation requirements of SFAS No. 133 for hedge
accounting in the first quarter of fiscal 2007 and will prospectively record the effective portion of the
change in fair value through Accumulated Other Comprehensive Income (Loss).
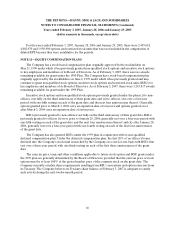
NOTE 16—FAIR VALUE OF FINANCIAL INSTRUMENTS
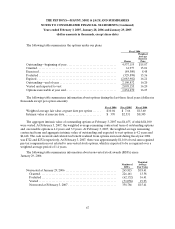
The estimated fair values of the Company’s financial instruments are as follows:
February 3, 2007 January 28, 2006
Carrying
Amount
Estimated
Fair Value
Carrying
Amount
Estimated
Fair Value
Assets:
Cash and cash equivalents . . . . . . . . . . . . . . . . . . . $ 21,884 $ 21,884 $ 48,281 $ 48,281
Accounts receivable. . . . . . . . . . . . . . . . . . . . . . . . . 29,582 29,582 36,434 36,434
Interest rate swap derivatives . . . . . . . . . . . . . . . . 5,522 5,522 5,790 5,790
Liabilities:
Accounts payable. . . . . . . . . . . . . . . . . . . . . . . . . . . 265,489 265,489 261,940 261,940
Long-term debt including current maturities . . . 538,521 530,721 468,496 444,585
Seniorconvertiblenotes..................... — — 119,000 114,835
CASH AND CASH EQUIVALENTS, ACCOUNTS RECEIVABLE AND ACCOUNTS PAYABLE
The carrying amounts approximate fair value because of the short maturity of these items.
INTEREST RATE SWAP DERIVATIVES
The fair value of the interest rate swap derivatives are obtained from dealer quotes. This value
represents the estimated amount the Company would receive or pay to terminate agreements, taking into
consideration current interest rates and the creditworthiness of the counterparties.
LONG-TERM DEBT INCLUDING CURRENT MATURITIES AND SENIOR CONVERTIBLE NOTES
Interest rates that are currently available to the Company for issuance of debt with similar terms and
remaining maturities are used to estimate fair value for debt issues that are not quoted on an exchange.
The fair value estimates presented herein are based on pertinent information available to
management as of February 3, 2007 and January 28, 2006. Although management is not aware of any
factors that would significantly affect the estimated fair value amounts, such amounts have not been
comprehensively revalued for purposes of these financial statements since those dates, and current
estimates of fair value may differ significantly from amounts presented herein.