Pep Boys 2006 Annual Report Download - page 61
Download and view the complete annual report
Please find page 61 of the 2006 Pep Boys annual report below. You can navigate through the pages in the report by either clicking on the pages listed below, or by using the keyword search tool below to find specific information within the annual report.-
 1
1 -
2
-
3
-
4
-
5
-
6
-
7
-
8
-
9
-
10
-
11
-
12
-
13
-
14
-
15
-
16
-
17
-
18
-
19
-
20
-
21
-
22
-
23
-
24
-
25
-
26
-
27
-
28
-
29
-
30
-
31
-
32
-
33
-
34
-
35
-
36
-
37
-
38
-
39
-
40
-
41
-
42
-
43
-
44
-
45
-
46
-
47
-
48
-
49
-
50
-
 51
51 -
 52
52 -
 53
53 -
 54
54 -
 55
55 -
 56
56 -
 57
57 -
 58
58 -
 59
59 -
 60
60 -
 61
61 -
 62
62 -
 63
63 -
 64
64 -
 65
65 -
 66
66 -
 67
67 -
 68
68 -
 69
69 -
 70
70 -
 71
71 -
72
-
73
-
74
-
75
-
76
-
77
-
78
-
79
-
80
-
81
-
82
-
83
-
84
-
85
-
86
-
87
-
88
-
89
-
90
-
91
-
92
-
93
-
94
-
95
-
96
-
97
-
98
-
99
-
100
-
101
-
102
-
103
-
104
-
105
-
106
-
107
-
108
-
109
-
110
-
111
-
112
-
113
-
114
-
115
-
116
-
117
-
118
-
119
-
120
-
121
-
122
-
123
-
124
-
125
-
126
-
127
-
128
-
129
-
130
-
131
-
132
-
133
-
134
-
135
-
136
 |
 |
22
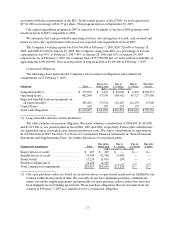
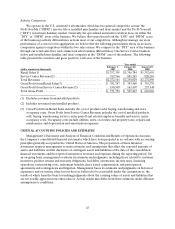
service center occupancy costs. Occupancy costs include utilities, rents, real estate and property taxes,
repairs and maintenance and depreciation and amortization expenses.
(3) As a percentage of related sales or revenue, as applicable.
(4) As a percentage of (Loss) Earnings from Continuing Operations Before Cumulative Effect of Change
in Accounting Principle
Fiscal 2006 vs. Fiscal 2005
Total revenues for fiscal 2006 increased 1.5%. Fiscal 2006 included 53 weeks versus 52 weeks in fiscal
2005. The 1.5% increase in revenue was the result of an additional week of sales along with increased
improvement in our service counter operations. On a 52 week basis, the Company had a decrease in
comparable store revenues of 0.2%. Comparable store service revenue increased 1.3% while comparable
store merchandise sales decreased 0.5%. All stores that are included in the comparable store sales base as
of the end of the period are included in the Company’s comparable store data calculations. Upon reaching
its 13th month of operation, a store is added to our comparable store sales base. Stores are removed from
the comparable store sales base upon their relocation or closure. Once a relocated store reaches its 13th
month of operation at its new location, it is added back into our comparable store sales base. Square
footage increases are infrequent and immaterial and, accordingly, are not considered in our calculations of
comparable store data.
Gross profit from merchandise sales increased, as a percentage of merchandise sales, to 28.8% in
fiscal 2006 from 25.7% in fiscal 2005. The increase in dollars was $63,098,000 or a 13.2% increase from the
prior year. This increase, as a percentage of merchandise sales, was due to improved product margins and
decreased warehousing costs partially offset by higher occupancy costs. The increase in merchandise
margins resulted from the restructuring of our vendor agreements, lower freight costs and lower
acquisition costs. Effective January 29, 2006, substantially all of our vendor agreements were restructured
to no longer identify specific incremental expenses for cooperative advertising; therefore all vendor
support funds are now treated as a reduction of inventories and are recognized as an increase to gross
profit from merchandise sales when the inventories are sold, in accordance with EITF 02-16. Gross profit
from merchandise sales from fiscal 2006 improved by approximately $37,100,000 compared to fiscal 2005,
primarily as a result of these changes. Warehousing costs were reduced due to a more efficient store
replenishment schedule and the absence in fiscal 2006 of certain costs associated with the fiscal 2005
relocation of our Southern California distribution center. Increased occupancy costs were the result of
higher utility costs and higher depreciation expense associated with our store remodel program. The
Company’s gross profit classification may not be comparable to the classification used by certain other
entities. Some entities (including the Company) include distribution, store occupancy, buying and other
costs in cost of goods sold. Other entities exclude such costs from gross profit, including them instead in
general and administrative and / or sales and marketing expenses.
Gross profit from service revenue increased, as a percentage of service revenue, to 8.0% in fiscal 2006
from 7.9% in fiscal 2005. The increase in dollars was $1,391,000 or a 4.6% increase from the prior year.
This increase as a percentage of service revenue was primarily due to lower workers compensation expense
and repairs and maintenance costs offset by cost associated with providing free or discounted towing
services to our customers.
Net gain from sales of assets increased, as percentage of total revenue to 0.7% from 0.2% in fiscal
2005. The $10,471,000 increase resulted from the sale of one owned property and the leasehold interest in
another in 2006 versus the sale of one owned property in 2005.
Selling, general and administrative expenses increased, as a percentage of total revenues, to 24.3% in
fiscal 2006 from 23.4% in fiscal 2005. This was a $27,713,000 or 5.3% increase over the prior year. This