Pep Boys 2006 Annual Report Download - page 91
Download and view the complete annual report
Please find page 91 of the 2006 Pep Boys annual report below. You can navigate through the pages in the report by either clicking on the pages listed below, or by using the keyword search tool below to find specific information within the annual report.-
 1
1 -
2
-
3
-
4
-
5
-
6
-
7
-
8
-
9
-
10
-
11
-
12
-
13
-
14
-
15
-
16
-
17
-
18
-
19
-
20
-
21
-
22
-
23
-
24
-
25
-
26
-
27
-
28
-
29
-
30
-
31
-
32
-
33
-
34
-
35
-
36
-
37
-
38
-
39
-
40
-
41
-
42
-
43
-
44
-
45
-
46
-
47
-
48
-
49
-
50
-
51
-
52
-
53
-
54
-
55
-
56
-
57
-
58
-
59
-
60
-
61
-
62
-
63
-
64
-
65
-
66
-
67
-
68
-
69
-
70
-
71
-
72
-
73
-
74
-
75
-
76
-
77
-
78
-
79
-
80
-
 81
81 -
 82
82 -
 83
83 -
 84
84 -
 85
85 -
 86
86 -
 87
87 -
 88
88 -
 89
89 -
 90
90 -
 91
91 -
 92
92 -
 93
93 -
 94
94 -
 95
95 -
 96
96 -
 97
97 -
 98
98 -
 99
99 -
 100
100 -
 101
101 -
102
-
103
-
104
-
105
-
106
-
107
-
108
-
109
-
110
-
111
-
112
-
113
-
114
-
115
-
116
-
117
-
118
-
119
-
120
-
121
-
122
-
123
-
124
-
125
-
126
-
127
-
128
-
129
-
130
-
131
-
132
-
133
-
134
-
135
-
136
 |
 |

THE PEP BOYS—MANNY, MOE & JACK AND SUBSIDIARIES
NOTES TO CONSOLIDATED FINANCIAL STATEMENTS (Continued)
Years ended February 3, 2007, January 28, 2006 and January 29, 2005
(dollar amounts in thousands, except share data)
52
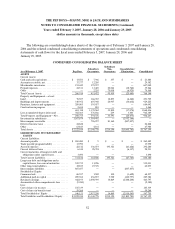
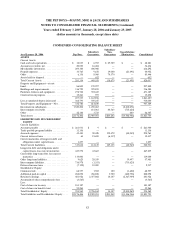
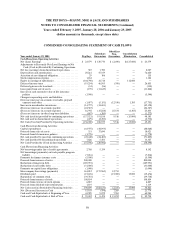
The following are consolidating balance sheets of the Company as of February 3, 2007 and January 28,
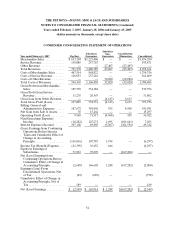
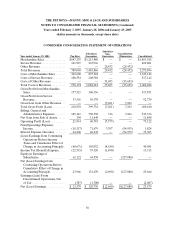
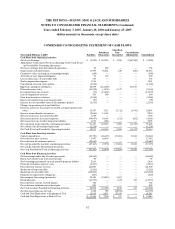
2006 and the related condensed consolidating statements of operations and condensed consolidating
statements of cash flows for the fiscal years ended February 3, 2007, January 28, 2006 and
January 29, 2005.
CONDENSED CONSOLIDATING BALANCE SHEET
As of February 3, 2007 Pep Boys
Subsidiary
Guarantors
Subsidiary
Non-
Guarantors
Consolidation /
Elimination Consolidated
ASSETS
Current Assets:
Cashandcashequivalents................. $ 13,581 $ 7,946 $ 357 $ — $ 21,884
Accountsreceivable,net.................. 17,377 12,205 — — 29,582
Merchandiseinventories.................. 211,445 395,597 — — 607,042
Prepaidexpenses........................ 24,511 13,469 20,044 (18,760) 39,264
Other . ............................... — 2,255 75,038 (6,925) 70,368
TotalCurrentAssets..................... 266,914 431,472 95,439 (25,685) 768,140
Property and Equipment—at cost:
Land................................. 78,507 166,767 12,893 (6,462) 251,705
Buildingsandimprovements............... 310,952 607,948 20,937 (10,612) 929,225
Furniture,fixturesandequipment .......... 289,005 395,037 — — 684,042
Constructioninprogress.................. 2,654 810 — — 3,464
681,118 1,170,562 33,830 (17,074) 1,868,436
Lessaccumulateddepreciationand ......... 382,363 576,186 239 3,401 962,189
TotalPropertyandEquipment—Net........ 298,755 594,376 33,591 (20,475) 906,247
Investmentinsubsidiaries................. 1,567,674 1,384,492 — (2,952,166) —
Intercompanyreceivable.................. — 726,297 81,160 (807,457) —
Deferredincometaxes................... 24,828 — — — 24,828
Other . ............................... 63,843 4,141 — — 67,984
TotalAssets ........................... $2,222,014 $3,140,778 $210,190 $(3,805,783) $1,767,199
LIABILITIES AND STOCKHOLDERS’
EQUITY
Current Liabilities:
Accountspayable....................... $ 265,480 $ 9 $ — $ — $ 265,489
Tradepayableprogramliability ............ 13,990 — — — 13,990
Accruedexpenses....................... 22,512 136,073 195,321 (61,626) 292,280
Currentdeferredtaxes................... 6,344 28,724 — (6,137) 28,931
Current maturities of long-term debt and
obligations under capital leases. . ......... 3,490 — — — 3,490
TotalCurrentLiabilities.................. 311,816 164,806 195,321 (67,763) 604,180
Long-term debt and obligations under
capital leases, less current maturities . . . . . . 523,735 11,296 — — 535,031
Other long-term liabilities. . . .............. 32,855 27,378 — — 60,233
Intercompanyliabilities................... 807,457 — — (807,457) —
Stockholders’ Equity:
Commonstock......................... 68,557 1,502 100 (1,602) 68,557
Additionalpaid-incapital................. 289,384 436,857 3,900 (440,757) 289,384
Retainedearnings....................... 442,193 2,498,939 10,869 (2,488,204) 463,797
Accumulated other comprehensive loss . . . . . . (9,380) — — — (9,380)
Less:
Costofsharesintreasury................. 185,339 — — — 185,339
Costofsharesinbenefitstrust............. 59,264 — — — 59,264
TotalStockholders’Equity................ 546,151 2,937,298 14,869 (2,930,563) 567,755
Total Liabilities and Stockholders’ Equity . . . . $2,222,014 $3,140,778 $210,190 $(3,805,783) $1,767,199