Pep Boys 2006 Annual Report Download - page 26
Download and view the complete annual report
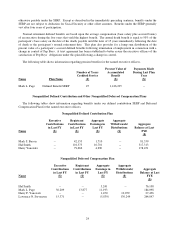
Please find page 26 of the 2006 Pep Boys annual report below. You can navigate through the pages in the report by either clicking on the pages listed below, or by using the keyword search tool below to find specific information within the annual report.-
 1
1 -
2
-
3
-
4
-
5
-
6
-
7
-
8
-
9
-
10
-
11
-
12
-
13
-
14
-
15
-
 16
16 -
 17
17 -
 18
18 -
 19
19 -
 20
20 -
 21
21 -
 22
22 -
 23
23 -
 24
24 -
 25
25 -
 26
26 -
 27
27 -
 28
28 -
 29
29 -
 30
30 -
 31
31 -
 32
32 -
 33
33 -
 34
34 -
 35
35 -
 36
36 -
37
-
38
-
39
-
40
-
41
-
42
-
43
-
44
-
45
-
46
-
47
-
48
-
49
-
50
-
51
-
52
-
53
-
54
-
55
-
56
-
57
-
58
-
59
-
60
-
61
-
62
-
63
-
64
-
65
-
66
-
67
-
68
-
69
-
70
-
71
-
72
-
73
-
74
-
75
-
76
-
77
-
78
-
79
-
80
-
81
-
82
-
83
-
84
-
85
-
86
-
87
-
88
-
89
-
90
-
91
-
92
-
93
-
94
-
95
-
96
-
97
-
98
-
99
-
100
-
101
-
102
-
103
-
104
-
105
-
106
-
107
-
108
-
109
-
110
-
111
-
112
-
113
-
114
-
115
-
116
-
117
-
118
-
119
-
120
-
121
-
122
-
123
-
124
-
125
-
126
-
127
-
128
-
129
-
130
-
131
-
132
-
133
-
134
-
135
-
136
 |
 |

20
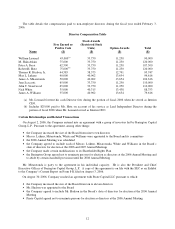
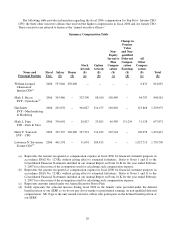
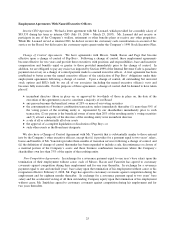
The following table provides information regarding the fiscal 2006 compensation for Pep Boys’ Interim CEO,
CFO, the three other executive officers that received the highest compensation in fiscal 2006 and our former CEO.
These executives are referred to herein as the “named executive officers.”
Summary Compensation Table
Name and
Principal Position
Fiscal
Year
Salary
($)
Bonus
($)
Stock
Awards
($)
(a)
Option
Awards
($)
(b)
Non-
Equity
Incentive
Plan
Compen-
sation
($)
(c)
Change in
Pension
Value
and Non-
qualified
Deferred
Compen-
sation
Earnings
($)
(d)
All
Other
Compen-
sation
($)
(e)
Total
($)
William Leonard 2006 553,846 250,000 -- -- -- -- 8,831 812,667
Chairman &
Interim CEO
(f)
Mark S. Bacon 2006 363,486 -- 323,799 88,010 108,489 -- 64,797 948,581
EVP – Operations
(g)
Hal Smith 2006 452,076 -- 304,027 314,155 109,849 -- 123,868 1,303,975
EVP – Merchandising
& Marketing
Mark L. Page 2006 359,692 -- 20,817 25,625 69,389 131,219 31,129 637,871
SVP – Parts & Tires
Harry F. Yanowitz 2006 397,307 340,000 327,574 154,832 102,744 -- 109,958 1,432,415
SVP - CFO
Lawrence N. Stevenson 2006 461,538 -- 31,634 209,815 -- -- 1,027,713 1,730,700
Former CEO
(h)
(a) Represents the amount recognized as compensation expense in fiscal 2006 for financial statement purposes in
accordance SFAS No. 123(R), without giving effect to estimated forfeitures. Refer to Notes 1 and 11 to the
Consolidated Financial Statements included in our Annual Report on Form 10-K for the year ended February
3, 2007 for a discussion of the assumptions used for calculating such compensation expense.
(b) Represents the amount recognized as compensation expense in fiscal 2006 for financial statement purposes in
accordance SFAS No. 123(R), without giving effect to estimated forfeitures. Refer to Notes 1 and 11 to the
Consolidated Financial Statements included in our Annual Report on Form 10-K for the year ended February
3, 2007 for a discussion of the assumptions used for calculating such compensation expense.
(c) Represents amounts earned under our Annual Incentive Bonus Plan.
(d) Solely represents the actuarial increase during fiscal 2006 in the benefit value provided under the defined
benefit portion of our SERP as we do not pay above-market or preferential earnings on non-qualified deferred
compensation. Mr. Page is the only named executive officer who participates in the defined benefit portion of
our SERP.