Pep Boys 2006 Annual Report Download - page 54
Download and view the complete annual report
Please find page 54 of the 2006 Pep Boys annual report below. You can navigate through the pages in the report by either clicking on the pages listed below, or by using the keyword search tool below to find specific information within the annual report.-
 1
1 -
2
-
3
-
4
-
5
-
6
-
7
-
8
-
9
-
10
-
11
-
12
-
13
-
14
-
15
-
16
-
17
-
18
-
19
-
20
-
21
-
22
-
23
-
24
-
25
-
26
-
27
-
28
-
29
-
30
-
31
-
32
-
33
-
34
-
35
-
36
-
37
-
38
-
39
-
40
-
41
-
42
-
43
-
 44
44 -
 45
45 -
 46
46 -
 47
47 -
 48
48 -
 49
49 -
 50
50 -
 51
51 -
 52
52 -
 53
53 -
 54
54 -
 55
55 -
 56
56 -
 57
57 -
 58
58 -
 59
59 -
 60
60 -
 61
61 -
 62
62 -
 63
63 -
 64
64 -
65
-
66
-
67
-
68
-
69
-
70
-
71
-
72
-
73
-
74
-
75
-
76
-
77
-
78
-
79
-
80
-
81
-
82
-
83
-
84
-
85
-
86
-
87
-
88
-
89
-
90
-
91
-
92
-
93
-
94
-
95
-
96
-
97
-
98
-
99
-
100
-
101
-
102
-
103
-
104
-
105
-
106
-
107
-
108
-
109
-
110
-
111
-
112
-
113
-
114
-
115
-
116
-
117
-
118
-
119
-
120
-
121
-
122
-
123
-
124
-
125
-
126
-
127
-
128
-
129
-
130
-
131
-
132
-
133
-
134
-
135
-
136
 |
 |
15
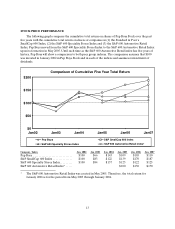
ITEM 7 MANAGEMENT’S DISCUSSION AND ANALYSIS OF FINANCIAL CONDITION AND
RESULTS OF OPERATIONS
OVERVIEW
Introduction
Pep Boys is a leader in the automotive aftermarket, with 593 stores and more than 6,000 service bays
located throughout 36 states and Puerto Rico. All of our stores feature the nationally recognized Pep Boys
brand name, established through more than 80 years of providing high-quality automotive merchandise
and services, and are company-owned, ensuring chain-wide consistency for our customers. We are the only
national chain offering automotive service, accessories, tires and parts under one roof, positioning us to
achieve our goal of becoming the category dominant one-stop shop for automotive maintenance and
accessories.
Of our 593 stores, 582 are what we refer to as SUPERCENTERS, which feature an average of 11
state-of-the-art service bays, with an average of more than 20,000 square feet per SUPERCENTER. Our
store size allows us to display and sell a more complete offering of merchandise in a wider array of
categories than our competitors, with a focus on the high-growth accessories segment and a comprehensive
tire offering. We leverage this investment in inventory through our ability to install what we sell in our
service bays and by offering this merchandise to both commercial and retail customers.
Our fiscal year ends on the Saturday nearest January 31, which results in an extra week every six years.
Our fiscal year ended February 3, 2007 was a 53-week year with the fourth quarter including 14 weeks
versus 13 weeks in fiscal 2005. All other years included in this report are 52 weeks.
Total revenues for the fiscal year ended February 3, 2007 were $2,272,161,000 as compared to the
$2,238,029,000 recorded in the prior year. On a 52 week basis, comparable merchandise sales decreased
0.5% and comparable service revenue increased 1.3%. While we believe the macro economic environment
negatively impacted our business throughout 2006, we were pleased with the increase in our service
revenue which showed steady improvement in the second half of fiscal 2006. Continued focus on our
service center productivity and service manager retention has helped recapture this market share.
Our net loss per share in the fifty-three weeks ended February 3, 2007 was $.05 per share or $.64 per
share improvement over the $.69 loss per share recorded in 2005. Continual focus on our business strategy
during the year permitted us to improve margins through better product acquisition costs and cost control
incentives, which resulted in a reduction of our loss per share.
In addition to the improved operating performance during 2006, the Company focused significantly on
improving its cash flow and strengthening its balance sheet. In the third quarter of 2006, we increased our
Senior Secured Term Loan facility to $320,000,000, in order to refinance our Convertible Senior Notes due
June 1, 2007, and extended the facility’s maturity to 2013, currently, the date of our first significant funded
debt maturity. Our cash flow from operating activities improved by $130,817,000 and capital expenditures
were $35,733,000 less then last year.
During 2006 we reinvested in our existing stores to redesign their interiors and enhance their exterior
appeal. Our new interior design features four distinct merchandising worlds: accessories (fashion,
electronic and performance merchandise), maintenance (hard parts and chemicals), garage (repair shop
and travel) and service (including tire, wheel and accessory installation). We believe that this layout
provides customers with a clear and concise way of finding what they need and promotes cross-selling.
Modifications to the exterior of our stores are designed to increase customer traffic.
During 2006 we grand reopened 104 Stores in the following markets: New York—32 (first quarter);
Denver, CO, Colorado Springs, CO, Orlando, FL, Miami, FL, and West Palm Beach, FL—34 (second
quarter); Northern Florida and Mobile-Pensacola, FL—13 (third quarter); Dallas, TX, Waco, TX,