Pep Boys 2006 Annual Report Download - page 95
Download and view the complete annual report
Please find page 95 of the 2006 Pep Boys annual report below. You can navigate through the pages in the report by either clicking on the pages listed below, or by using the keyword search tool below to find specific information within the annual report.-
 1
1 -
2
-
3
-
4
-
5
-
6
-
7
-
8
-
9
-
10
-
11
-
12
-
13
-
14
-
15
-
16
-
17
-
18
-
19
-
20
-
21
-
22
-
23
-
24
-
25
-
26
-
27
-
28
-
29
-
30
-
31
-
32
-
33
-
34
-
35
-
36
-
37
-
38
-
39
-
40
-
41
-
42
-
43
-
44
-
45
-
46
-
47
-
48
-
49
-
50
-
51
-
52
-
53
-
54
-
55
-
56
-
57
-
58
-
59
-
60
-
61
-
62
-
63
-
64
-
65
-
66
-
67
-
68
-
69
-
70
-
71
-
72
-
73
-
74
-
75
-
76
-
77
-
78
-
79
-
80
-
81
-
82
-
83
-
84
-
 85
85 -
 86
86 -
 87
87 -
 88
88 -
 89
89 -
 90
90 -
 91
91 -
 92
92 -
 93
93 -
 94
94 -
 95
95 -
 96
96 -
 97
97 -
 98
98 -
 99
99 -
 100
100 -
 101
101 -
 102
102 -
 103
103 -
 104
104 -
 105
105 -
106
-
107
-
108
-
109
-
110
-
111
-
112
-
113
-
114
-
115
-
116
-
117
-
118
-
119
-
120
-
121
-
122
-
123
-
124
-
125
-
126
-
127
-
128
-
129
-
130
-
131
-
132
-
133
-
134
-
135
-
136
 |
 |

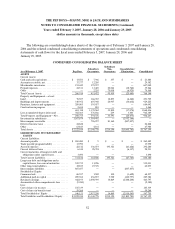
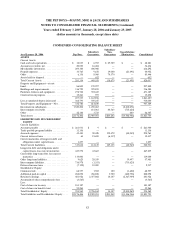
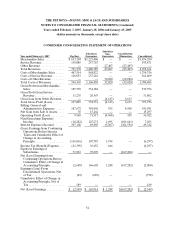
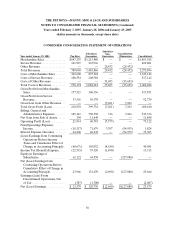
THE PEP BOYS—MANNY, MOE & JACK AND SUBSIDIARIES
NOTES TO CONSOLIDATED FINANCIAL STATEMENTS (Continued)
Years ended February 3, 2007, January 28, 2006 and January 29, 2005
(dollar amounts in thousands, except share data)
56
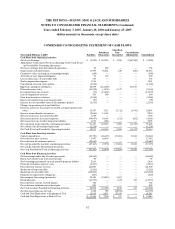
CONDENSED CONSOLIDATING STATEMENT OF OPERATIONS
Year ended January 29, 2005 Pep Boys
Subsidiary
Guarantors
Subsidiary
Non-
Guarantors
Consolidation /
Elimination Consolidated
Merchandise Sales . . . . . . . . . . . . . . . $647,135 $1,215,880 $ — $ — $1,863,015
Service Revenue. . . . . . . . . . . . . . . . . 141,915 267,966 — — 409,881
Other Revenue . . . . . . . . . . . . . . . . . . — — 28,432 (28,432) —
Total Revenues. . . . . . . . . . . . . . . . . . 789,050 1,483,846 28,432 (28,432) 2,272,896
Costs of Merchandise Sales . . . . . . . 469,620 875,524 — — 1,345,144
Costs of Service Revenue . . . . . . . . . 108,554 208,588 — — 317,142
Costs of Other Revenue . . . . . . . . . . — — 35,693 (35,693) —
Total Costs of Revenues . . . . . . . . . . 578,174 1,084,112 35,693 (35,693) 1,662,286
Gross Profit from Merchandise
Sales . . . . . . . . . . . . . . . . . . . . . . . . . 177,515 340,356 — — 517,871
Gross Profit from Service
Revenue...................... 33,361 59,378 — — 92,739
Gross Loss from Other Revenue. . . — — (7,261) 7,261 —
Total Gross Profit (Loss) . . . . . . . . . 210,876 399,734 (7,261) 7,261 610,610
Selling, General and
Administrative Expenses . . . . . . . 189,161 350,598 316 7,261 547,336
Net Gain from Sale of Assets. . . . . . 199 11,649 — — 11,848
Operating Profit (Loss). . . . . . . . . . . 21,914 60,785 (7,577) — 75,122
Non(Operating (Expense)
Income....................... (18,317) 71,679 3,397 (54,935) 1,824
Interest Expense (Income). . . . . . . . 64,268 26,632 — (54,935) 35,965
(Loss) Earnings from Continuing
Operations Before Income
Taxes and Cumulative Effect of
Change in Accounting Principle . (60,671) 105,832 (4,180) — 40,981
Income Tax (Benefit) Expense . . . . (22,515) 39,320 (1,490) 15,315
Equity in Earnings of
Subsidiaries . . . . . . . . . . . . . . . . . . . 62,122 64,958 — (127,080) —
Net (Loss) Earnings from
Continuing Operations Before
Cumulative Effect of Change in
Accounting Principle. . . . . . . . . . . 23,966 131,470 (2,690) (127,080) 25,666
Earnings (Loss) From
Discontinued Operations, Net
ofTax........................ (387) (1,700) — — (2,087)
Net (Loss) Earnings. . . . . . . . . . . . . . $ 23,579 $ 129,770 $ (2,690) $(127,080) $ 23,579