Pep Boys 2006 Annual Report Download - page 93
Download and view the complete annual report
Please find page 93 of the 2006 Pep Boys annual report below. You can navigate through the pages in the report by either clicking on the pages listed below, or by using the keyword search tool below to find specific information within the annual report.-
 1
1 -
2
-
3
-
4
-
5
-
6
-
7
-
8
-
9
-
10
-
11
-
12
-
13
-
14
-
15
-
16
-
17
-
18
-
19
-
20
-
21
-
22
-
23
-
24
-
25
-
26
-
27
-
28
-
29
-
30
-
31
-
32
-
33
-
34
-
35
-
36
-
37
-
38
-
39
-
40
-
41
-
42
-
43
-
44
-
45
-
46
-
47
-
48
-
49
-
50
-
51
-
52
-
53
-
54
-
55
-
56
-
57
-
58
-
59
-
60
-
61
-
62
-
63
-
64
-
65
-
66
-
67
-
68
-
69
-
70
-
71
-
72
-
73
-
74
-
75
-
76
-
77
-
78
-
79
-
80
-
81
-
82
-
 83
83 -
 84
84 -
 85
85 -
 86
86 -
 87
87 -
 88
88 -
 89
89 -
 90
90 -
 91
91 -
 92
92 -
 93
93 -
 94
94 -
 95
95 -
 96
96 -
 97
97 -
 98
98 -
 99
99 -
 100
100 -
 101
101 -
 102
102 -
 103
103 -
104
-
105
-
106
-
107
-
108
-
109
-
110
-
111
-
112
-
113
-
114
-
115
-
116
-
117
-
118
-
119
-
120
-
121
-
122
-
123
-
124
-
125
-
126
-
127
-
128
-
129
-
130
-
131
-
132
-
133
-
134
-
135
-
136
 |
 |

THE PEP BOYS—MANNY, MOE & JACK AND SUBSIDIARIES
NOTES TO CONSOLIDATED FINANCIAL STATEMENTS (Continued)
Years ended February 3, 2007, January 28, 2006 and January 29, 2005
(dollar amounts in thousands, except share data)
54
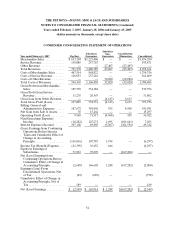
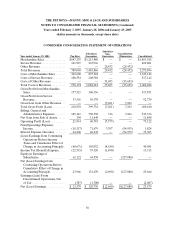
CONDENSED CONSOLIDATING STATEMENT OF OPERATIONS
Year ended February 3, 2007 Pep Boys
Subsidiary
Guarantors
Subsidiary
Non-
Guarantors
Consolidation /
Elimination Consolidated
Merchandise Sales . . . . . . . . . . . . . . $ 653,284 $1,223,006 $ — $ — $1,876,290
Service Revenue. . . . . . . . . . . . . . . . 138,088 257,783 — — 395,871
Other Revenue . . . . . . . . . . . . . . . . . — — 27,407 (27,407) —
Total Revenues. . . . . . . . . . . . . . . . . 791,372 1,480,789 27,407 (27,407) 2,272,161
Costs of Merchandise Sales . . . . . . 467,514 868,822 — — 1,336,336
Costs of Service Revenue . . . . . . . . 126,853 237,216 — — 364,069
Costs of Other Revenue . . . . . . . . . — — 32,020 (32,020) —
Total Costs of Revenues . . . . . . . . . 594,367 1,106,038 32,020 (32,020) 1,700,405
Gross Profit from Merchandise
Sales . . . . . . . . . . . . . . . . . . . . . . . . 185,770 354,184 — — 539,954
Gross Profit from Service
Revenue..................... 11,235 20,567 — — 31,802
Gross Loss from Other Revenue. . — — (4,613) 4,613 —
Total Gross Profit (Loss) . . . . . . . . 197,005 374,751 (4,613) 4,613 571,756
Selling, General and
Administrative Expenses . . . . . . 187,672 358,496 355 4,508 551,031
Net Gain from Sale of Assets. . . . . 35 15,262 — — 15,297
Operating Profit (Loss). . . . . . . . . . 9,368 31,517 (4,968) 105 36,022
Non(Operating (Expense)
Income. . . . . . . . . . . . . . . . . . . . . . (18,282) 125,271 1,695 (101,661) 7,023
Interest Expense (Income). . . . . . . 107,102 49,003 (5,207) (101,556) 49,342
(Loss) Earnings from Continuing
Operations Before Income
Taxes and Cumulative Effect of
Change in Accounting
Principle..................... (116,016) 107,785 1,934 — (6,297)
Income Tax (Benefit) Expense . . . (41,395) 36,452 646 (4,297)
Equity in Earnings of
Subsidiaries.................. 71,932 95,270 — (167,202) —
Net (Loss) Earnings from
Continuing Operations Before
Cumulative Effect of Change in
Accounting Principle. . . . . . . . . . (2,689) 166,603 1,288 (167,202) (2,000)
Earnings (Loss) From
Discontinued Operations, Net
ofTax....................... (49) (689) — — (738)
Cumulative Effect of Change in
Accounting Principle, Net of
Tax......................... 189 — — — 189
Net (Loss) Earnings. . . . . . . . . . . . . $ (2,549) $ 165,914 $ 1,288 $(167,202) $ (2,549)