Pep Boys 2006 Annual Report Download - page 73
Download and view the complete annual report
Please find page 73 of the 2006 Pep Boys annual report below. You can navigate through the pages in the report by either clicking on the pages listed below, or by using the keyword search tool below to find specific information within the annual report.-
 1
1 -
2
-
3
-
4
-
5
-
6
-
7
-
8
-
9
-
10
-
11
-
12
-
13
-
14
-
15
-
16
-
17
-
18
-
19
-
20
-
21
-
22
-
23
-
24
-
25
-
26
-
27
-
28
-
29
-
30
-
31
-
32
-
33
-
34
-
35
-
36
-
37
-
38
-
39
-
40
-
41
-
42
-
43
-
44
-
45
-
46
-
47
-
48
-
49
-
50
-
51
-
52
-
53
-
54
-
55
-
56
-
57
-
58
-
59
-
60
-
61
-
62
-
 63
63 -
 64
64 -
 65
65 -
 66
66 -
 67
67 -
 68
68 -
 69
69 -
 70
70 -
 71
71 -
 72
72 -
 73
73 -
 74
74 -
 75
75 -
 76
76 -
 77
77 -
 78
78 -
 79
79 -
 80
80 -
 81
81 -
 82
82 -
 83
83 -
84
-
85
-
86
-
87
-
88
-
89
-
90
-
91
-
92
-
93
-
94
-
95
-
96
-
97
-
98
-
99
-
100
-
101
-
102
-
103
-
104
-
105
-
106
-
107
-
108
-
109
-
110
-
111
-
112
-
113
-
114
-
115
-
116
-
117
-
118
-
119
-
120
-
121
-
122
-
123
-
124
-
125
-
126
-
127
-
128
-
129
-
130
-
131
-
132
-
133
-
134
-
135
-
136
 |
 |

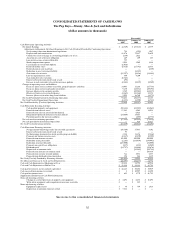
See notes to the consolidated financial statements
34
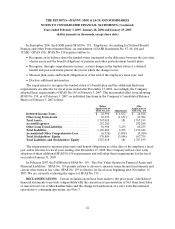
CONSOLIDATED STATEMENTS OF STOCKHOLDERS’ EQUITY
The Pep Boys—Manny, Moe & Jack and Subsidiaries
(dollar amounts in thousands, except share data)
Common Stock Additional
Paid-in Retained Treasury Stock
Accumulated
Other
Comprehensive Benefits Total
Stockholders’
Shares Amount Capital Earnings Shares Amount Loss Trust Equity
Balance, January 31, 2004 .............. 63,910,577 $ 63,911 $ 177,317 $ 531,933 (8,928,159) $ (144,148) $ (15) $ (59,264) $ 569,734
Comprehensive Income:
Netincome...................... 23,579
Minimum pension liability adjustment, net
oftax......................... (5,799)
Fair market value adjustment on derivatives,
netoftax...................... 962
TotalComprehensiveIncome............ 18,742
IssuanceofCommonStock............. 4,646,464 4,646 104,208 108,854
Cashdividends($.27pershare) .......... (15,676) (15,676)
Effect of stock options and related tax
benefits......................... 2,064 (2,984) 638,210 10,137 9,217
Stockcompensationexpense ............ 1,184 1,184
Repurchase of Common Stock . .......... (3,077,000) (39,718) (39,718)
Dividendreinvestmentplan............. 193 (72) 61,819 998 1,119
Balance, January 29, 2005 .............. 68,557,041 68,557 284,966 536,780 (11,305,130) (172,731) (4,852) (59,264) 653,456
Comprehensive Loss:
Netloss......................... (37,528)
Minimum pension liability adjustment, net
oftax......................... (22)
Fair market value adjustment on derivatives,
netoftax...................... 1,309
TotalComprehensiveLoss.............. (36,241)
Cash dividends ($.27 per share) .......... (14,686) (14,686)
Effect of stock options and related tax
benefits......................... 1,719 (2,520) 338,856 5,592 4,791
Effect of restricted stock unit conversions. . . . (636) 28,981 433 (203)
Stockcompensationexpense ............ 2,049 2,049
Repurchase of Common Stock . .......... (1,282,600) (15,562) (15,562)
Dividendreinvestmentplan............. (120) 66,925 1,081 961
Balance, January 28, 2006 .............. 68,557,041 68,557 288,098 481,926 (12,152,968) (181,187) (3,565) (59,264) 594,565
Comprehensive Loss:
Netloss......................... (2,549)
Minimum pension liability adjustment, net
oftax......................... 887
Fair market value adjustment on derivatives,
netoftax...................... (3,648)
TotalComprehensiveLoss.............. (5,310)
Cash dividends ($.27 per share) .......... (14,757) (14,757)
Incremental effect from adoption of FAS
No.158,netoftax.................. (3,054) (3,054)
Effect of stock options and related tax
benefits. . . . ..................... (669) (657) 80,641 1,387 61
Effect of restricted stock unit conversions. . . . (1,096) 74,107 712 (384)
Stockcompensationexpense ............ 3,051 3,051
Repurchase of Common Stock . .......... (494,800) (7,311) (7,311)
Dividendreinvestmentplan............. (166) 65,333 1,060 894
Balance, February 3, 2007 .............. 68,557,041 $ 68,557 $ 289,384 $ 463,797 (12,427,687) $ (185,339) $ (9,380) $ (59,264) $ 567,755