Pep Boys 2006 Annual Report Download - page 80
Download and view the complete annual report
Please find page 80 of the 2006 Pep Boys annual report below. You can navigate through the pages in the report by either clicking on the pages listed below, or by using the keyword search tool below to find specific information within the annual report.-
 1
1 -
2
-
3
-
4
-
5
-
6
-
7
-
8
-
9
-
10
-
11
-
12
-
13
-
14
-
15
-
16
-
17
-
18
-
19
-
20
-
21
-
22
-
23
-
24
-
25
-
26
-
27
-
28
-
29
-
30
-
31
-
32
-
33
-
34
-
35
-
36
-
37
-
38
-
39
-
40
-
41
-
42
-
43
-
44
-
45
-
46
-
47
-
48
-
49
-
50
-
51
-
52
-
53
-
54
-
55
-
56
-
57
-
58
-
59
-
60
-
61
-
62
-
63
-
64
-
65
-
66
-
67
-
68
-
69
-
 70
70 -
 71
71 -
 72
72 -
 73
73 -
 74
74 -
 75
75 -
 76
76 -
 77
77 -
 78
78 -
 79
79 -
 80
80 -
 81
81 -
 82
82 -
 83
83 -
 84
84 -
 85
85 -
 86
86 -
 87
87 -
 88
88 -
 89
89 -
 90
90 -
91
-
92
-
93
-
94
-
95
-
96
-
97
-
98
-
99
-
100
-
101
-
102
-
103
-
104
-
105
-
106
-
107
-
108
-
109
-
110
-
111
-
112
-
113
-
114
-
115
-
116
-
117
-
118
-
119
-
120
-
121
-
122
-
123
-
124
-
125
-
126
-
127
-
128
-
129
-
130
-
131
-
132
-
133
-
134
-
135
-
136
 |
 |

THE PEP BOYS—MANNY, MOE & JACK AND SUBSIDIARIES
NOTES TO CONSOLIDATED FINANCIAL STATEMENTS (Continued)
Years ended February 3, 2007, January 28, 2006 and January 29, 2005
(dollar amounts in thousands, except share data)
41
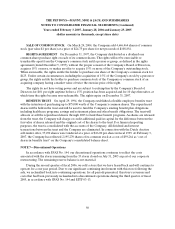
The following table illustrates the effect on net earnings and earnings per share if the Company had
applied the fair value recognition provisions of SFAS No. 123, “Accounting for Stock-Based
Compensation,” to stock-based employee compensation for the fiscal years ended as follows:
January 28,
2006
January 29,
2005
Net (loss) earnings:
As reported. . . . . . . . . . . . . . . . . . . . . . . . . . . . . . . . . . . . . . . . . . . . . . . . . . . $(37,528) $23,579
Add:Stock-basedcompensationforRSU’s,netoftax.............. 1,301 741
Less: Total stock-based compensation expense determined under fair
value-basedmethod,netoftax................................ (3,121) (2,858)
Pro forma . . . . . . . . . . . . . . . . . . . . . . . . . . . . . . . . . . . . . . . . . . . . . . . . . . . . $(39,348) $21,462
Netearnings(loss)pershare:
Basic:
Asreported............................................... $ (0.69) $ 0.42
Proforma................................................ $ (0.72) $ 0.38
Diluted:
Asreported............................................... $ (0.69) $ 0.41
Proforma................................................ $ (0.72) $ 0.38
Expected volatility is based on historical volatilities for a time period similar to that of the expected
term. In estimating the expected term of the options, the Company has utilized the “simplified method”
allowable under the Securities and Exchange Commission, or SEC, Staff Accounting Bulletin No. 107,
Share-Based Payment. The risk-free rate is based on the U.S. treasury yield curve for issues with a
remaining term equal to the expected term. The fair value of each option granted during fiscal years 2006,
2005 and 2004 is estimated on the date of grant using the Black-Scholes option-pricing model with the
following weighted-average assumptions:
Year ended
February 3, January 28, January 29,
2007 2006 2005
Dividendyield ..................................... 2.02% 1.77% 1.67%
Expectedvolatility.................................. 53% 41% 41%
Risk-free interest rate range:
High.............................................. 4.8% 4.6% 4.8%
Low............................................... 4.6% 3.5% 2.0%
Rangesofexpectedlivesinyears ..................... 5-7 3-8 4-8
SFAS No. 123R also requires the Company to change the classification, in its consolidated statement
of cash flows, of any excess tax benefits realized upon the exercise of stock options or issuance of RSUs, in
excess of that which is associated with the expense recognized for financial reporting purposes.
Approximately $95 is reflected as a financing cash inflow rather than as a reduction of income taxes paid in
the consolidated statement of cash flows for fiscal year 2006.