Pep Boys 2006 Annual Report Download - page 74
Download and view the complete annual report
Please find page 74 of the 2006 Pep Boys annual report below. You can navigate through the pages in the report by either clicking on the pages listed below, or by using the keyword search tool below to find specific information within the annual report.-
 1
1 -
2
-
3
-
4
-
5
-
6
-
7
-
8
-
9
-
10
-
11
-
12
-
13
-
14
-
15
-
16
-
17
-
18
-
19
-
20
-
21
-
22
-
23
-
24
-
25
-
26
-
27
-
28
-
29
-
30
-
31
-
32
-
33
-
34
-
35
-
36
-
37
-
38
-
39
-
40
-
41
-
42
-
43
-
44
-
45
-
46
-
47
-
48
-
49
-
50
-
51
-
52
-
53
-
54
-
55
-
56
-
57
-
58
-
59
-
60
-
61
-
62
-
63
-
 64
64 -
 65
65 -
 66
66 -
 67
67 -
 68
68 -
 69
69 -
 70
70 -
 71
71 -
 72
72 -
 73
73 -
 74
74 -
 75
75 -
 76
76 -
 77
77 -
 78
78 -
 79
79 -
 80
80 -
 81
81 -
 82
82 -
 83
83 -
 84
84 -
85
-
86
-
87
-
88
-
89
-
90
-
91
-
92
-
93
-
94
-
95
-
96
-
97
-
98
-
99
-
100
-
101
-
102
-
103
-
104
-
105
-
106
-
107
-
108
-
109
-
110
-
111
-
112
-
113
-
114
-
115
-
116
-
117
-
118
-
119
-
120
-
121
-
122
-
123
-
124
-
125
-
126
-
127
-
128
-
129
-
130
-
131
-
132
-
133
-
134
-
135
-
136
 |
 |

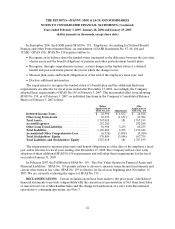
See notes to the consolidated financial statements
35
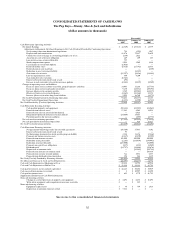
CONSOLIDATED STATEMENTS OF CASH FLOWS
The Pep Boys—Manny, Moe & Jack and Subsidiaries
(dollar amounts in thousands)
Year ended
February 3,
2007
January 28,
2006
January 29,
2005
Cash Flows from Operating Activities:
Net(Loss)Earnings ................................................................. $ (2,549) $ (37,528) $ 23,579
Adjustments to Reconcile Net (Loss) Earnings to Net Cash (Used in) Provided by Continuing Operations:
Net(earnings)lossfromdiscontinuedoperations ......................................... 738 (292) 2,087
Depreciationandamortization...................................................... 88,476 79,887 76,620
Cumulativeeffectofchangeinaccountingprinciple,netoftax................................ (189) 2,021 —
Accretionofassetretirementobligation................................................ 269 109 135
Lossondefeasanceofconvertibledebt................................................. 755 — —
Stockcompensationexpense........................................................ 3,051 2,049 1,184
Cancellationofvestedstockoptions................................................... (1,056) — —
Deferred income taxes . ........................................................... (8,316) (27,792) 26,853
Deferred gain on sale leaseback. . . ................................................... — — (130)
Reductioninassetretirementliability ................................................. — (1,815) —
Gain from sales of assets........................................................... (15,297) (4,826) (11,848)
Lossonimpairmentofassets........................................................ 840 4,200 —
Gain from derivative valuation . . . ................................................... (5,568) — —
Excesstaxbenefitsfromstockbasedawards............................................. (95) — —
Increaseincashsurrendervalueoflifeinsurancepolicies.................................... (2,143) (3,389) (3,540)
Changes in operating assets and liabilities:
Decrease(increase)inaccountsreceivable,prepaidexpensesandother.......................... 24,045 15,166 (17,753)
Decrease(increase)inmerchandiseinventories........................................... 9,250 (13,532) (49,198)
Increase(decrease)inaccountspayable................................................ 3,549 (49,041) (24,387)
(Decrease)increaseinaccruedexpenses................................................ (4,165) (18,864) 25,853
Increase(decrease)inotherlong-termliabilities.......................................... 2,093 16,760 (1,272)
NetCashProvided(Usedin)byContinuingOperations........................................ 93,688 (36,887) 48,183
NetCashUsedinDiscontinuedOperations................................................. (1,258) (1,500) (2,732)
NetCashProvidedby(Usedin)OperatingActivities............................................ 92,430 (38,387) 45,451
Cash Flows from Investing Activities:
Cashpaidforpropertyandequipment................................................. (50,212) (85,945) (88,068)
Proceeds from sales of assets. . . . . . . . ................................................ 17,542 4,043 18,021
Proceeds from sales of assets held for disposal ........................................... — 6,913 —
(Repayment)proceedsfromlifeinsurancepolicies........................................ (24,669) 24,655 —
Premiumspaidonlifeinsurancepolicies ............................................... — (605) (1,778)
Net cash used in continuing operations . ................................................... (57,339) (50,939) (71,825)
Netcashprovidedbydiscontinuedoperations............................................... — 916 13,327
NetCashUsedinInvestingActivities....................................................... (57,339) (50,023) (58,498)
Cash Flows from Financing Activities:
Net(payments)borrowingsunderlineofcreditagreements.................................. (48,569) 57,985 8,102
Excesstaxbenefitsfromstockbasedawards............................................. 95 — —
Net borrowings (payments) on trade payable program liability ................................ 2,834 11,156 (7,216)
Payments for finance issuance costs . . . . ............................................... (2,217) (5,150) (5,500)
Proceedsfromissuanceofnotes ..................................................... 121,000 200,000 200,000
Reductionoflong-termdebt........................................................ (2,263) (183,459) (189,991)
Reductionofconvertibledebt....................................................... (119,000) — (31,000)
Paymentsoncapitalleaseobligations.................................................. (227) (383) (1,040)
Dividendspaid ................................................................. (14,757) (14,686) (15,676)
Repurchaseofcommonstock....................................................... — (15,562) (39,718)
Proceedsfromissuanceofcommonstock............................................... — — 108,854
Proceedsfromexerciseofstockoptions................................................ 722 3,071 6,887
Proceedsfromdividendreinvestmentplan.............................................. 894 961 1,119
NetCash(Usedin)ProvidedbyFinancingActivities ............................................ (61,488) 53,933 34,821
Net (Decrease) Increase in Cash and Cash Equivalents. . . . ....................................... (26,397) (34,477) 21,774
Cash and Cash Equivalents at Beginning of Year ............................................... 48,281 82,758 60,984
CashandCashEquivalentsatEndofYear................................................... $ 21,884 $ 48,281 $ 82,758
Cash paid for interest, net of amounts capitalized. . . . ........................................... $ 46,245 $ 50,602 $ 30,019
Cashreceivedfromincometaxrefunds...................................................... $ 1 $ 10,097 $ 23,290
Cashpaidforincometaxes .............................................................. $ 632 $ 1,770 $ 48,732
Supplemental Disclosure of Cash Flow Information:
Non-cash investing activities:
Changesinaccruedpurchasesofpropertyandequipment ................................... $ 3,691 $ 6,138 $ 15,698
Writeoffofequipmentandrecognitionofinsurancereceivable ............................... $ — $ 345 $ —
Non-cash financing activities:
Equipmentcapitalleases .......................................................... $ 84 $ 789 $ 1,413
Repurchaseofcommonstocknotsettled............................................... $ 7,311 $ — $ —