Pep Boys 2006 Annual Report Download - page 28
Download and view the complete annual report
Please find page 28 of the 2006 Pep Boys annual report below. You can navigate through the pages in the report by either clicking on the pages listed below, or by using the keyword search tool below to find specific information within the annual report.-
 1
1 -
2
-
3
-
4
-
5
-
6
-
7
-
8
-
9
-
10
-
11
-
12
-
13
-
14
-
15
-
16
-
17
-
 18
18 -
 19
19 -
 20
20 -
 21
21 -
 22
22 -
 23
23 -
 24
24 -
 25
25 -
 26
26 -
 27
27 -
 28
28 -
 29
29 -
 30
30 -
 31
31 -
 32
32 -
 33
33 -
 34
34 -
 35
35 -
 36
36 -
 37
37 -
 38
38 -
39
-
40
-
41
-
42
-
43
-
44
-
45
-
46
-
47
-
48
-
49
-
50
-
51
-
52
-
53
-
54
-
55
-
56
-
57
-
58
-
59
-
60
-
61
-
62
-
63
-
64
-
65
-
66
-
67
-
68
-
69
-
70
-
71
-
72
-
73
-
74
-
75
-
76
-
77
-
78
-
79
-
80
-
81
-
82
-
83
-
84
-
85
-
86
-
87
-
88
-
89
-
90
-
91
-
92
-
93
-
94
-
95
-
96
-
97
-
98
-
99
-
100
-
101
-
102
-
103
-
104
-
105
-
106
-
107
-
108
-
109
-
110
-
111
-
112
-
113
-
114
-
115
-
116
-
117
-
118
-
119
-
120
-
121
-
122
-
123
-
124
-
125
-
126
-
127
-
128
-
129
-
130
-
131
-
132
-
133
-
134
-
135
-
136
 |
 |

22
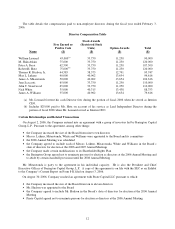
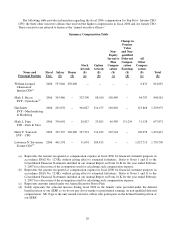
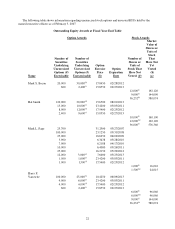
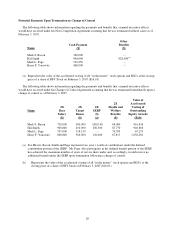
The following table shows information regarding unexercised stock options and unvested RSUs held by the
named executive officers as of February 3, 2007
Outstanding Equity Awards at Fiscal Year-End Table
Option Awards Stock Awards
Name
Number of
Securities
Underlying
Unexercised
Options (#)
Exercisable
Number of
Securities
Underlying
Unexercised
Options (#)
Unexercisable
Option
Exercise
Price
($)
Option
Expiration
Date
Number of
Shares or
Units of
Stock That
Have Not
Vested (#)
Market
Value of
Shares or
Units of
Stock
That
Have Not
Yet
Vested
($)
(a)
Mark S. Bacon 20,000 30,000
(b)
17.8450 02/28/2012
600 2,400
(c)
15.8550 02/27/2013
12,000
(i)
192,120
9,000
(j)
144,090
36,232
(k)
580,074
Hal Smith 120,000 30,000
(d)
15.6500 08/01/2013
15,000 10,000
(e)
23.4200 03/03/2011
8,000 12,000
(f)
17.5400 02/25/2012
2,400 9,600
(c)
15.8550 02/27/2013
10,000
(l)
160,100
12,000
(m)
192,120
36,000
(j)
576,360
Mark L. Page 25,700 31.2500 03/27/2007
100,000 23.1250 03/31/2008
25,000 18.6250 06/02/2009
3,900 6.3438 03/28/2010
7,000 6.2188 04/17/2010
10,000 6.4000 03/26/2011
25,000 16.2150 05/29/2012
12,000 3,000
(g)
7.6000 03/25/2013
1,500 1,000
(e)
23.4200 03/03/2011
1,000 1,500
(f)
17.5400 02/25/2012
1,000
(l)
16,010
1,500
(m)
24,015
Harry F.
Yanowitz 100,000 25,000
(h)
10.4250 06/09/2013
9,000 6,000
(e)
23.4200 03/03/2011
4,000 6,000
(f)
17.5400 02/25/2012
600 2,400
(c)
15.8550 02/27/2013
6,000
(l)
96,060
6,000
(m)
96,060
9,000
(j)
144,090
36,232
(n)
580,074