Pep Boys 2006 Annual Report Download - page 40
Download and view the complete annual report
Please find page 40 of the 2006 Pep Boys annual report below. You can navigate through the pages in the report by either clicking on the pages listed below, or by using the keyword search tool below to find specific information within the annual report.-
 1
1 -
2
-
3
-
4
-
5
-
6
-
7
-
8
-
9
-
10
-
11
-
12
-
13
-
14
-
15
-
16
-
17
-
18
-
19
-
20
-
21
-
22
-
23
-
24
-
25
-
26
-
27
-
28
-
29
-
 30
30 -
 31
31 -
 32
32 -
 33
33 -
 34
34 -
 35
35 -
 36
36 -
 37
37 -
 38
38 -
 39
39 -
 40
40 -
 41
41 -
 42
42 -
 43
43 -
 44
44 -
 45
45 -
 46
46 -
 47
47 -
 48
48 -
 49
49 -
 50
50 -
51
-
52
-
53
-
54
-
55
-
56
-
57
-
58
-
59
-
60
-
61
-
62
-
63
-
64
-
65
-
66
-
67
-
68
-
69
-
70
-
71
-
72
-
73
-
74
-
75
-
76
-
77
-
78
-
79
-
80
-
81
-
82
-
83
-
84
-
85
-
86
-
87
-
88
-
89
-
90
-
91
-
92
-
93
-
94
-
95
-
96
-
97
-
98
-
99
-
100
-
101
-
102
-
103
-
104
-
105
-
106
-
107
-
108
-
109
-
110
-
111
-
112
-
113
-
114
-
115
-
116
-
117
-
118
-
119
-
120
-
121
-
122
-
123
-
124
-
125
-
126
-
127
-
128
-
129
-
130
-
131
-
132
-
133
-
134
-
135
-
136
 |
 |

2
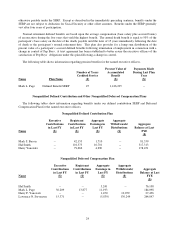
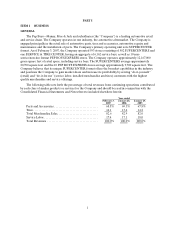
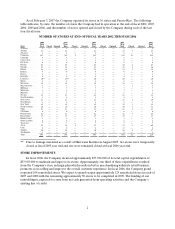
As of February 3, 2007 the Company operated its stores in 36 states and Puerto Rico. The following
table indicates, by state, the number of stores the Company had in operation at the end of fiscal 2002, 2003,
2004, 2005and 2006, and the number of stores opened and closed by the Company during each of the last
four fiscal years:
NUMBER OF STORES AT END OF FISCAL YEARS 2002 THROUGH 2006
State
2006
Year
End Closed Opened
2005
Year
End Closed Opened
2004
Year
End Closed Opened
2003
Year
End Closed Opened
2002
Year
End
Alabama........ 1— — 1 — — 1 — — 1 — — 1
Arizona......... 22 — — 22 — — 22 — — 22 1 — 23
Arkansas........ 1— — 1 — — 1 — — 1 — — 1
California ....... 121 — — 121 1 — 122 — — 122 12 — 134
Colorado ........ 8— — 8 — — 8 — — 8 — — 8
Connecticut...... 8— — 8 — — 8 — — 8 — — 8
Delaware........ 6— — 6 — — 6 — — 6 — — 6
Florida ......... 43 — — 43 — — 43 — — 43 4 — 47
Georgia......... 25 — — 25 — — 25 — — 25 1 — 26
Illinois.......... 23 — — 23 — — 23 — — 23 1 — 24
Indiana......... 9— — 9 — — 9 — — 9 — — 9
Kansas.......... 2— — 2 — — 2 — — 2 — — 2
Kentucky........ 4— — 4 — — 4 — — 4 — — 4
Louisiana........ 10** —— 10
** ——10——10——10
Maine.......... 1— — 1 — — 1 — — 1 — — 1
Maryland........ 19 — — 19 — — 19 — — 19 — — 19
Massachusetts .... 7— — 7 — — 7 — — 7 1 — 8
Michigan........ 7— — 7 — — 7 — — 7 — — 7
Minnesota....... 3— — 3 — — 3 — — 3 — — 3
Missouri ........ 1— — 1 — — 1 — — 1 — — 1
Nevada......... 12 — — 12 — — 12 — — 12 — — 12
New Hampshire . . . 4— — 4 — — 4 — — 4 — — 4
NewJersey....... 28 — — 28 — — 28 — — 28 1 — 29
NewMexico...... 8— — 8 — — 8 — — 8 — — 8
NewYork....... 29 — — 29 — — 29 — — 29 2 — 31
NorthCarolina.... 10 — — 10 — — 10 — — 10 1 — 11
Ohio........... 12 — — 12 — — 12 — — 12 1 — 13
Oklahoma....... 6— — 6 — — 6 — — 6 — — 6
Pennsylvania . . . . . 42 — — 42 — — 42 — — 42 3 — 45
PuertoRico...... 27 — — 27 — — 27 — — 27 — — 27
RhodeIsland..... 3— — 3 — — 3 — — 3 — — 3
SouthCarolina.... 6—— 6 — — 6 — — 6 — — 6
Tennessee....... 7— — 7 — — 7 — — 7 — — 7
Texas .......... 54 — — 54 1 — 55 — — 55 5 — 60
Utah........... 6— — 6 — — 6 — — 6 — — 6
Virginia . ........ 16 — — 16 — — 16 — — 16 1 — 17
Washington . . . . . . 2— — 2 — — 2 — — 2 — — 2
Total........... 593 — — 593 2 — 595 — — 595 34 — 629
** Due to damage sustained as a result of Hurricane Katrina in August 2005, two stores were temporarily
closed at fiscal 2005 year end and one store remained closed at fiscal 2006 year end.
STORE IMPROVEMENTS
In fiscal 2006, the Company incurred approximately $37,924,000 of its total capital expenditures of
$53,903,000 to maintain and improve its stores. Approximately one third of these expenditures resulted
from the Company’s store redesign plan which results in better merchandising within its retail business,
promotes cross-selling and improves the overall customer experience. In fiscal 2006, the Company grand
reopened 104 remodeled stores. We expect to grand reopen approximately 125 remodeled stores in each of
2007 and 2008 with the remaining approximately 50 stores to be completed in 2009. The funding of our
remodelings is expected to come from net cash generated from operating activities and the Company’s
existing line of credit.