Pep Boys 2006 Annual Report Download - page 62
Download and view the complete annual report
Please find page 62 of the 2006 Pep Boys annual report below. You can navigate through the pages in the report by either clicking on the pages listed below, or by using the keyword search tool below to find specific information within the annual report.-
 1
1 -
2
-
3
-
4
-
5
-
6
-
7
-
8
-
9
-
10
-
11
-
12
-
13
-
14
-
15
-
16
-
17
-
18
-
19
-
20
-
21
-
22
-
23
-
24
-
25
-
26
-
27
-
28
-
29
-
30
-
31
-
32
-
33
-
34
-
35
-
36
-
37
-
38
-
39
-
40
-
41
-
42
-
43
-
44
-
45
-
46
-
47
-
48
-
49
-
50
-
51
-
 52
52 -
 53
53 -
 54
54 -
 55
55 -
 56
56 -
 57
57 -
 58
58 -
 59
59 -
 60
60 -
 61
61 -
 62
62 -
 63
63 -
 64
64 -
 65
65 -
 66
66 -
 67
67 -
 68
68 -
 69
69 -
 70
70 -
 71
71 -
 72
72 -
73
-
74
-
75
-
76
-
77
-
78
-
79
-
80
-
81
-
82
-
83
-
84
-
85
-
86
-
87
-
88
-
89
-
90
-
91
-
92
-
93
-
94
-
95
-
96
-
97
-
98
-
99
-
100
-
101
-
102
-
103
-
104
-
105
-
106
-
107
-
108
-
109
-
110
-
111
-
112
-
113
-
114
-
115
-
116
-
117
-
118
-
119
-
120
-
121
-
122
-
123
-
124
-
125
-
126
-
127
-
128
-
129
-
130
-
131
-
132
-
133
-
134
-
135
-
136
 |
 |
23
increase, as a percentage of total revenues, was due primarily to higher net media expense offset by
reduced general office expense. The increase in net media expense was caused by a change in our vendor
agreements which resulted in a different application of EITF 02-16, whereby approximately $35,700,000 in
vendor support funds were recorded as a reduction to advertising cost in fiscal 2005 (see above explanation
of vendor agreement restructuring). General office expense was favorable by $5,007,000 primarily due to
the Company incurring a $4,200,000 software impairment charge in fiscal 2005.
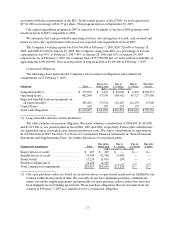
Interest expense increased $302,000 to $49,342,000 in fiscal 2006 from fiscal 2005. Included in fiscal
2006 was $4,200,000 of costs associated with the early satisfaction and discharge of $119,000,000 4% Senior
Convertible Notes due in June, 2007 and in fiscal 2005, $ 9,738,000 in interest and fees associated with the
early satisfaction and discharge of our $43,000,000 6.88% Medium Term Notes and $100,000,000 6.92%
Term Enhanced Remarketable Securities (TERMS). Also in fiscal 2006, the Company incurred a higher
weighted average interest rate, offset by lower debt levels and a reduction to interest expense for the
increase in the fair value of the interest rate swap of $1,490,000.
Non-operating income increased as a percentage of total revenues from 0.2% in 2005 to 0.3% in 2006.
This 80% increase of $3,126,000 was a result of interest earned on the investment of funds used for the
early satisfaction and discharge of the Senior Convertible notes.
Our income tax benefit as a percentage of loss from continuing operations before income taxes and
cumulative effect of change in accounting principle increased to 68.2% or $4,297,000 versus 36.5% or
$20,569,000. The increase in the effective rate is due to a non-cash adjustment of $2,451,000 to our state
deferred liabilities resulting from a change in the Company’s filing position.
Loss from discontinued operations decreased from a gain of $292,000, net of tax, in fiscal 2005 to a
loss of $738,000, net of tax, in fiscal 2006 due to continuing expenses incurred from locations associated
with the corporate restructuring which occurred in fiscal 2003.
Net loss decreased, as a percentage of total revenues, due primarily to an increase in gross profit from
merchandise sales as a percentage of merchandise sales, an increase in gain on sale of assets, increase in
non-operating income offset by higher selling, general and administrative expenses.
Effects of Inflation
The Company uses the LIFO method of inventory valuation. Thus, the cost of merchandise sold
approximates current cost. Although the Company cannot accurately determine the precise effect of
inflation on its operations, it does not believe inflation has had a material effect on revenues or results of
operations during all fiscal years presented.
Fiscal 2005 vs. Fiscal 2004
Total revenues for fiscal 2005 decreased 1.5%. This decrease was due primarily to a decrease in
comparable store revenues of 1.3%. Comparable store service revenue decreased 6.1% while comparable
store merchandise sales decreased 0.2%.
Gross profit from merchandise sales decreased, as a percentage of merchandise sales, to 25.7% in
fiscal 2005 from 27.8% in fiscal 2004. This was a 7.9% or $41,015,000 decrease from the prior year. This
decrease, as a percentage of merchandise sales, was due to increases in warehousing costs and occupancy
costs, and decreases in merchandise margins. The increase in warehousing costs was from increases in rent
expense and rental equipment for the new warehouse in San Bernardino, CA. The increase in store
occupancy costs was due to increased lease expense associated with the new point-of sale system and
building and equipment maintenance expenses related to the store refurbishment program. The decrease
in merchandise margin resulted from higher tire costs, a less favorable product mix consisting of more sales
from lower margin products and higher freight costs.