Lenovo 2009 Annual Report Download - page 99
Download and view the complete annual report
Please find page 99 of the 2009 Lenovo annual report below. You can navigate through the pages in the report by either clicking on the pages listed below, or by using the keyword search tool below to find specific information within the annual report.-
 1
1 -
2
-
3
-
4
-
5
-
6
-
7
-
8
-
9
-
10
-
11
-
12
-
13
-
14
-
15
-
16
-
17
-
18
-
19
-
20
-
21
-
22
-
23
-
24
-
25
-
26
-
27
-
28
-
29
-
30
-
31
-
32
-
33
-
34
-
35
-
36
-
37
-
38
-
39
-
40
-
41
-
42
-
43
-
44
-
45
-
46
-
47
-
48
-
49
-
50
-
51
-
52
-
53
-
54
-
55
-
56
-
57
-
58
-
59
-
60
-
61
-
62
-
63
-
64
-
65
-
66
-
67
-
68
-
69
-
70
-
71
-
72
-
73
-
74
-
75
-
76
-
77
-
78
-
79
-
80
-
81
-
82
-
83
-
84
-
85
-
86
-
87
-
88
-
 89
89 -
 90
90 -
 91
91 -
 92
92 -
 93
93 -
 94
94 -
 95
95 -
 96
96 -
 97
97 -
 98
98 -
 99
99 -
 100
100 -
 101
101 -
 102
102 -
 103
103 -
 104
104 -
 105
105 -
 106
106 -
 107
107 -
 108
108 -
 109
109 -
110
-
111
-
112
-
113
-
114
-
115
-
116
-
117
-
118
-
119
-
120
-
121
-
122
-
123
-
124
-
125
-
126
-
127
-
128
-
129
-
130
-
131
-
132
-
133
-
134
-
135
-
136
-
137
-
138
-
139
-
140
-
141
-
142
-
143
-
144
-
145
-
146
-
147
-
148
-
149
-
150
-
151
-
152
-
153
-
154
-
155
-
156
 |
 |

2008/09 Annual Report Lenovo Group Limited
97
3 Financial risk management (continued)
(a) Financial risk factors (continued)
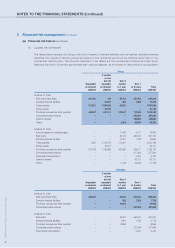
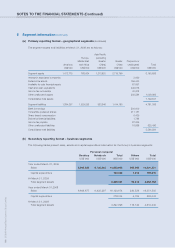
(v) Liquidity risk (continued)
The tables below analyze the Group’s and the Company’s derivative financial instruments that will be settled on
a gross basis into relevant maturity groupings based on the remaining period at the balance sheet date to the
contractual maturity date. The amounts disclosed in the tables are the contractual undiscounted cash flows.
Balances due within 12 months approximate their carrying balances, as the impact of discounting is not significant.
Group
3 months
or less
but not Over 3
Repayable repayable months Over 1
on demand on demand to 1 year to 5 years Total
US$’000 US$’000 US$’000 US$’000 US$’000
At March 31, 2009
Forward foreign exchange contracts:
– outflow – 534,495 – – 534,495
– inflow – 526,287 – – 526,287
Interest rate swap contracts:
– outflow – 3,300 8,243 4,162 15,705
– inflow – 1,717 3,900 2,244 7,861
At March 31, 2008
Forward foreign exchange contracts:
– outflow – 1,117,419 – – 1,117,419
– inflow – 1,105,808 – – 1,105,808
Interest rate swap contracts:
– outflow – 2,805 8,865 13,966 25,636
– inflow – 2,931 6,608 13,845 23,384
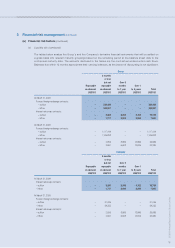
Company
3 months
or less
but not Over 3
Repayable repayable months Over 1
on demand on demand to 1 year to 5 years Total
US$’000 US$’000 US$’000 US$’000 US$’000
At March 31, 2009
Interest rate swap contracts
– outflow – 3,300 8,243 4,162 15,705
– inflow – 1,717 3,900 2,244 7,861
At March 31, 2008
Forward foreign exchange contracts:
– outflow – 31,246 – – 31,246
– inflow – 29,255 – – 29,255
Interest rate swap contracts:
– outflow – 2,805 8,865 13,966 25,636
– inflow – 2,931 6,608 13,845 23,384