Lenovo 2009 Annual Report Download - page 110
Download and view the complete annual report
Please find page 110 of the 2009 Lenovo annual report below. You can navigate through the pages in the report by either clicking on the pages listed below, or by using the keyword search tool below to find specific information within the annual report.-
 1
1 -
2
-
3
-
4
-
5
-
6
-
7
-
8
-
9
-
10
-
11
-
12
-
13
-
14
-
15
-
16
-
17
-
18
-
19
-
20
-
21
-
22
-
23
-
24
-
25
-
26
-
27
-
28
-
29
-
30
-
31
-
32
-
33
-
34
-
35
-
36
-
37
-
38
-
39
-
40
-
41
-
42
-
43
-
44
-
45
-
46
-
47
-
48
-
49
-
50
-
51
-
52
-
53
-
54
-
55
-
56
-
57
-
58
-
59
-
60
-
61
-
62
-
63
-
64
-
65
-
66
-
67
-
68
-
69
-
70
-
71
-
72
-
73
-
74
-
75
-
76
-
77
-
78
-
79
-
80
-
81
-
82
-
83
-
84
-
85
-
86
-
87
-
88
-
89
-
90
-
91
-
92
-
93
-
94
-
95
-
96
-
97
-
98
-
99
-
 100
100 -
 101
101 -
 102
102 -
 103
103 -
 104
104 -
 105
105 -
 106
106 -
 107
107 -
 108
108 -
 109
109 -
 110
110 -
 111
111 -
 112
112 -
 113
113 -
 114
114 -
 115
115 -
 116
116 -
 117
117 -
 118
118 -
 119
119 -
 120
120 -
121
-
122
-
123
-
124
-
125
-
126
-
127
-
128
-
129
-
130
-
131
-
132
-
133
-
134
-
135
-
136
-
137
-
138
-
139
-
140
-
141
-
142
-
143
-
144
-
145
-
146
-
147
-
148
-
149
-
150
-
151
-
152
-
153
-
154
-
155
-
156
 |
 |

2008/09 Annual Report Lenovo Group Limited
108
NOTES TO THE FINANCIAL STATEMENTS (Continued)
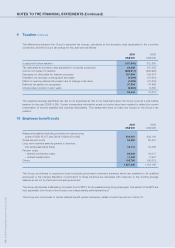
9 Taxation (continued)
The differences between the Group’s expected tax charge, calculated at the domestic rates applicable to the countries
concerned, and the Group’s tax charge for the year were as follows:
2009 2008
US$’000 US$’000
(Loss)/profit before taxation (187,945) 512,850
Tax calculated at domestic rates applicable in countries concerned 24,689 107,552
Income not subject to taxation (248,517) (209,925)
Expenses not deductible for taxation purposes 237,954 130,574
Utilization of previously unrecognized tax losses (1,699) (21,610)
Effect on opening deferred tax assets due to change in tax rates (1,993) (16,202)
Deferred tax assets not recognized 37,304 47,868
(Over)/under provision in prior years (9,294) 9,356
38,444 47,613
The weighted average applicable tax rate is not presented as this is not meaningful given the Group incurred a loss before
taxation for the year (2008: 9.3%). Certain comparative information as set out above have been restated to reflect the current
presentation of income taxability and expense deductibility. The restatement does not have any impact on the Group’s tax
position.
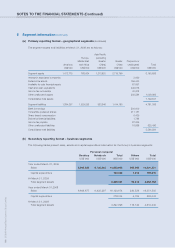
10 Employee benefit costs
2009 2008
US$’000 US$’000
Wages and salaries (including provision for restructuring
costs of US$116,077,000 (2008: US$44,070,000)) 939,421 929,106
Social security costs 98,250 85,201
Long-term incentive awards granted to directors
and employees (Note 30(a)) 54,114 53,328
Pension costs
– defined contribution plans 25,403 19,017
– defined benefit plans 11,302 6,931
Others 108,760 100,613
1,237,250 1,194,196
The Group contributes to respective local municipal government retirement schemes which are available to all qualified
employees in the Chinese Mainland. Contributions to these schemes are calculated with reference to the monthly average
salaries as set out by the local municipal government.
The Group participates a Mandatory Provident Fund (“MPF”) for all qualified Hong Kong employees. The assets of the MPF are
held separately from those of the Group in an independently administered fund.
The Group also contributes to certain defined benefit pension schemes, details of which are set out in Note 37.