Lenovo 2009 Annual Report Download - page 101
Download and view the complete annual report
Please find page 101 of the 2009 Lenovo annual report below. You can navigate through the pages in the report by either clicking on the pages listed below, or by using the keyword search tool below to find specific information within the annual report.-
 1
1 -
2
-
3
-
4
-
5
-
6
-
7
-
8
-
9
-
10
-
11
-
12
-
13
-
14
-
15
-
16
-
17
-
18
-
19
-
20
-
21
-
22
-
23
-
24
-
25
-
26
-
27
-
28
-
29
-
30
-
31
-
32
-
33
-
34
-
35
-
36
-
37
-
38
-
39
-
40
-
41
-
42
-
43
-
44
-
45
-
46
-
47
-
48
-
49
-
50
-
51
-
52
-
53
-
54
-
55
-
56
-
57
-
58
-
59
-
60
-
61
-
62
-
63
-
64
-
65
-
66
-
67
-
68
-
69
-
70
-
71
-
72
-
73
-
74
-
75
-
76
-
77
-
78
-
79
-
80
-
81
-
82
-
83
-
84
-
85
-
86
-
87
-
88
-
89
-
90
-
 91
91 -
 92
92 -
 93
93 -
 94
94 -
 95
95 -
 96
96 -
 97
97 -
 98
98 -
 99
99 -
 100
100 -
 101
101 -
 102
102 -
 103
103 -
 104
104 -
 105
105 -
 106
106 -
 107
107 -
 108
108 -
 109
109 -
 110
110 -
 111
111 -
112
-
113
-
114
-
115
-
116
-
117
-
118
-
119
-
120
-
121
-
122
-
123
-
124
-
125
-
126
-
127
-
128
-
129
-
130
-
131
-
132
-
133
-
134
-
135
-
136
-
137
-
138
-
139
-
140
-
141
-
142
-
143
-
144
-
145
-
146
-
147
-
148
-
149
-
150
-
151
-
152
-
153
-
154
-
155
-
156
 |
 |

2008/09 Annual Report Lenovo Group Limited
99
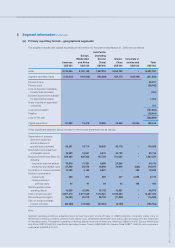
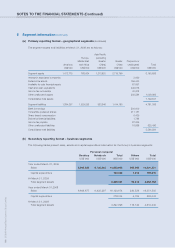
3 Financial risk management (continued)
(c) Capital risks management
The Group’s objectives when managing capital are to safeguard the Group’s ability to continue as a going concern in
order to provide returns for shareholders and benefits for other stakeholders and to maintain an optimal capital structure
to reduce the cost of capital.
In order to maintain or adjust the capital structure, the Group may adjust the amount of dividends paid to shareholders,
return capital to shareholders, issue new shares or sell assets to reduce debt.
Consistent with others in the industry, the Group monitors capital on the basis of the gearing ratio. This ratio is calculated
as total borrowings (including current and non-current borrowings) divided by total equity.
The Group’s strategy remains unchanged and the gearing ratios and the net cash position of the Group as at March 31,
2009 and 2008 are as follows:
2009 2008
US$ million US$ million
Bank deposits and cash and cash equivalents (Note 26) 1,863 2,191
Less: total borrowings (685) (561)
Net cash position 1,178 1,630
Total equity 1,311 1,613
Gearing ratio 0.52 0.35
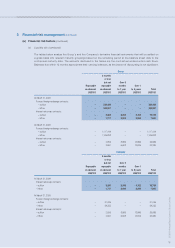
(d) Fair value estimation
The fair value of financial instruments traded in active markets (such as trading and available-for-sale securities) is based
on quoted market prices at the balance sheet date. The quoted market price used for financial assets held by the Group
is the current bid price.
The fair value of financial instruments that are not traded in an active market (for example, over-the-counter derivatives) is
determined by using valuation techniques. The Group uses a variety of methods and makes assumptions that are based
on market conditions existing at each balance sheet date. Quoted market prices or dealer quotes for similar instruments
are used for long-term debt. Other techniques, such as estimated discounted cash flows, are used to determine fair
value for the remaining financial instruments. The fair value of interest rate swaps is calculated as the present value of
the estimated future cash flows. The fair value of forward foreign exchange contracts is determined using quoted forward
exchange rates at the balance sheet date.
The carrying value less impairment provision of trade receivables and payables is a reasonable approximation of their fair
values. The fair value of financial liabilities for disclosure purposes is estimated by discounting the future contractual cash
flows at the current market interest rate that is available to the Group for similar financial instruments.