Lenovo 2009 Annual Report Download - page 4
Download and view the complete annual report
Please find page 4 of the 2009 Lenovo annual report below. You can navigate through the pages in the report by either clicking on the pages listed below, or by using the keyword search tool below to find specific information within the annual report.-
 1
1 -
 2
2 -
 3
3 -
 4
4 -
 5
5 -
 6
6 -
 7
7 -
 8
8 -
 9
9 -
 10
10 -
 11
11 -
 12
12 -
 13
13 -
 14
14 -
 15
15 -
16
-
17
-
18
-
19
-
20
-
21
-
22
-
23
-
24
-
25
-
26
-
27
-
28
-
29
-
30
-
31
-
32
-
33
-
34
-
35
-
36
-
37
-
38
-
39
-
40
-
41
-
42
-
43
-
44
-
45
-
46
-
47
-
48
-
49
-
50
-
51
-
52
-
53
-
54
-
55
-
56
-
57
-
58
-
59
-
60
-
61
-
62
-
63
-
64
-
65
-
66
-
67
-
68
-
69
-
70
-
71
-
72
-
73
-
74
-
75
-
76
-
77
-
78
-
79
-
80
-
81
-
82
-
83
-
84
-
85
-
86
-
87
-
88
-
89
-
90
-
91
-
92
-
93
-
94
-
95
-
96
-
97
-
98
-
99
-
100
-
101
-
102
-
103
-
104
-
105
-
106
-
107
-
108
-
109
-
110
-
111
-
112
-
113
-
114
-
115
-
116
-
117
-
118
-
119
-
120
-
121
-
122
-
123
-
124
-
125
-
126
-
127
-
128
-
129
-
130
-
131
-
132
-
133
-
134
-
135
-
136
-
137
-
138
-
139
-
140
-
141
-
142
-
143
-
144
-
145
-
146
-
147
-
148
-
149
-
150
-
151
-
152
-
153
-
154
-
155
-
156
 |
 |

2008/09 Annual Report Lenovo Group Limited
2
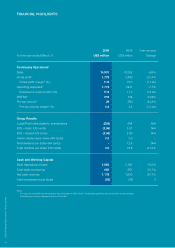
FINANCIAL HIGHLIGHTS
2008/09 Annual Report Lenovo Group Limited
2
2009 2008 Year-on-year
For the year ended March 31 US$ million US$ million Change
Continuing Operations1
Sales 14,901 16,352 -8.9%
Gross profit2 1,779 2,450 -27.4%
Gross profit margin2 (%) 11.9 15.0 -3.1 pts
Operating expenses2 1,773 1,921 -7.7%
Expense-to-revenue ratio2 (%) 11.9 11.7 0.2 pts
EBITDA2 216 798 -72.9%
Pre-tax income2 29 560 -94.8%
Pre-tax income margin2 (%) 0.2 3.4 -3.2 pts
Group Results
(Loss)/Profit attributable to shareholders (226) 484 N/A
EPS – basic (US cents) (2.56) 5.51 N/A
EPS – diluted (US cents) (2.56) 5.06 N/A
Interim dividend per share (HK cents) 3.0 3.0 –
Final dividend per share (HK cents) – 12.8 N/A
Total dividend per share (HK cents) 3.0 15.8 -81.0%
Cash and Working Capital
Bank deposits and cash 1,863 2,191 -15.0%
Total bank borrowings 685 561 22.1%
Net cash reserves 1,178 1,630 -27.7%
Cash conversion cycle (days) (23) (28) 5
Notes:
1 The disposal of mobile handset business was completed in March 2008. Continuing operations exclude mobile handset business.
2 Excluding restructuring charges and one-off charges.