Lenovo 2009 Annual Report Download - page 5
Download and view the complete annual report
Please find page 5 of the 2009 Lenovo annual report below. You can navigate through the pages in the report by either clicking on the pages listed below, or by using the keyword search tool below to find specific information within the annual report.-
 1
1 -
 2
2 -
 3
3 -
 4
4 -
 5
5 -
 6
6 -
 7
7 -
 8
8 -
 9
9 -
 10
10 -
 11
11 -
 12
12 -
 13
13 -
 14
14 -
 15
15 -
 16
16 -
17
-
18
-
19
-
20
-
21
-
22
-
23
-
24
-
25
-
26
-
27
-
28
-
29
-
30
-
31
-
32
-
33
-
34
-
35
-
36
-
37
-
38
-
39
-
40
-
41
-
42
-
43
-
44
-
45
-
46
-
47
-
48
-
49
-
50
-
51
-
52
-
53
-
54
-
55
-
56
-
57
-
58
-
59
-
60
-
61
-
62
-
63
-
64
-
65
-
66
-
67
-
68
-
69
-
70
-
71
-
72
-
73
-
74
-
75
-
76
-
77
-
78
-
79
-
80
-
81
-
82
-
83
-
84
-
85
-
86
-
87
-
88
-
89
-
90
-
91
-
92
-
93
-
94
-
95
-
96
-
97
-
98
-
99
-
100
-
101
-
102
-
103
-
104
-
105
-
106
-
107
-
108
-
109
-
110
-
111
-
112
-
113
-
114
-
115
-
116
-
117
-
118
-
119
-
120
-
121
-
122
-
123
-
124
-
125
-
126
-
127
-
128
-
129
-
130
-
131
-
132
-
133
-
134
-
135
-
136
-
137
-
138
-
139
-
140
-
141
-
142
-
143
-
144
-
145
-
146
-
147
-
148
-
149
-
150
-
151
-
152
-
153
-
154
-
155
-
156
 |
 |

2008/09 Annual Report Lenovo Group Limited
3
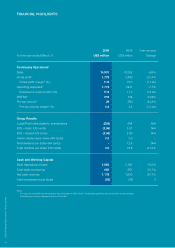
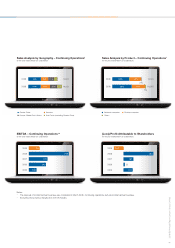
Notes:
1 The disposal of mobile handset business was completed in March 2008. Continuing operations exclude mobile handset business.
2 Excluding restructuring charges and one-off charges.
Sales Analysis by Geography – Continuing Operations1
for the year ended March 31 (US$ million)
Sales Analysis by Product – Continuing Operations1
for the year ended March 31 (US$ million)
(Loss)/Profit Attributable to Shareholders
for the year ended March 31 (US$ million)
Greater China
Europe, Middle East & Africa
Americas
Asia Pacific (excluding Greater China)
Notebook computer
Others
Desktop computer
2009
37% 28% 22% 13%
2008
2009
2008
2007
2006
2005
484
(226)
161
22
144
43% 25% 21%
11%
58% 40%
2009 14,901
16,352
2%
1%
2008 58% 41%
14,901
16,352
EBITDA – Continuing Operations1,2
for the year ended March 31 (US$ million)
2008
2009
2007
2006
2005
798
216
375
343
155