Lenovo 2009 Annual Report Download - page 119
Download and view the complete annual report
Please find page 119 of the 2009 Lenovo annual report below. You can navigate through the pages in the report by either clicking on the pages listed below, or by using the keyword search tool below to find specific information within the annual report.-
 1
1 -
2
-
3
-
4
-
5
-
6
-
7
-
8
-
9
-
10
-
11
-
12
-
13
-
14
-
15
-
16
-
17
-
18
-
19
-
20
-
21
-
22
-
23
-
24
-
25
-
26
-
27
-
28
-
29
-
30
-
31
-
32
-
33
-
34
-
35
-
36
-
37
-
38
-
39
-
40
-
41
-
42
-
43
-
44
-
45
-
46
-
47
-
48
-
49
-
50
-
51
-
52
-
53
-
54
-
55
-
56
-
57
-
58
-
59
-
60
-
61
-
62
-
63
-
64
-
65
-
66
-
67
-
68
-
69
-
70
-
71
-
72
-
73
-
74
-
75
-
76
-
77
-
78
-
79
-
80
-
81
-
82
-
83
-
84
-
85
-
86
-
87
-
88
-
89
-
90
-
91
-
92
-
93
-
94
-
95
-
96
-
97
-
98
-
99
-
100
-
101
-
102
-
103
-
104
-
105
-
106
-
107
-
108
-
 109
109 -
 110
110 -
 111
111 -
 112
112 -
 113
113 -
 114
114 -
 115
115 -
 116
116 -
 117
117 -
 118
118 -
 119
119 -
 120
120 -
 121
121 -
 122
122 -
 123
123 -
 124
124 -
 125
125 -
 126
126 -
 127
127 -
 128
128 -
 129
129 -
130
-
131
-
132
-
133
-
134
-
135
-
136
-
137
-
138
-
139
-
140
-
141
-
142
-
143
-
144
-
145
-
146
-
147
-
148
-
149
-
150
-
151
-
152
-
153
-
154
-
155
-
156
 |
 |

2008/09 Annual Report Lenovo Group Limited
117
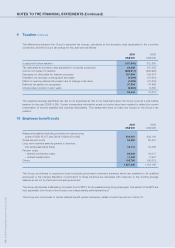
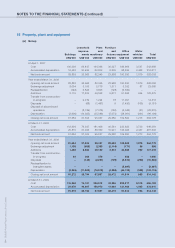
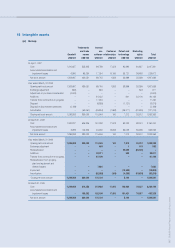
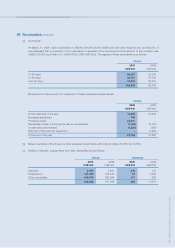
18 Intangible assets
(a) Group
Trademarks Internal
and trade use Customer Patent and Marketing
Goodwill names software relationships technology rights Total
US$’000 US$’000 US$’000 US$’000 US$’000 US$’000 US$’000
At April 1, 2007
Cost 1,310,657 525,305 86,799 17,023 92,690 64,887 2,097,361
Accumulated amortization and
impairment losses 6,990 95,254 17,054 15,165 58,721 36,488 229,672
Net book amount 1,303,667 430,051 69,745 1,858 33,969 28,399 1,867,689
Year ended March, 31 2008
Opening net book amount 1,303,667 430,051 69,745 1,858 33,969 28,399 1,867,689
Exchange adjustment (560) – 694 – – 543 677
Adjustment on purchase consideration (4,000) – – – – – (4,000)
Additions – – 61,422 – 641 32,100 94,163
Transfer from construction-in-progress – – 17,494 – – – 17,494
Disposal – – (6,955) – (1,121) – (8,076)
Disposal of discontinued operations (2,169) – – – – – (2,169)
Amortization – (50,051) (26,854) (1,698) (26,277) (22,530) (127,410)
Closing net book amount 1,296,938 380,000 115,546 160 7,212 38,512 1,838,368
At March 31, 2008
Cost 1,300,837 525,305 161,038 17,023 92,220 98,001 2,194,424
Accumulated amortization and
impairment losses 3,899 145,305 45,492 16,863 85,008 59,489 356,056
Net book amount 1,296,938 380,000 115,546 160 7,212 38,512 1,838,368
Year ended March, 31 2009
Opening net book amount 1,296,938 380,000 115,546 160 7,212 38,512 1,838,368
Exchange adjustment – – 463 – 1 118 582
Reclassification – – – – 20,000 (20,000) –
Additions – – 22,011 – 900 – 22,911
Transfer from construction-in-progress – – 67,109 – – – 67,109
Reclassification from property,
plant and equipment and
deferred assets – – 7,620 – – – 7,620
Impairment – – – – (18,526) – (18,526)
Amortization – – (42,025) (160) (4,388) (18,630) (65,203)
Closing net book amount 1,296,938 380,000 170,724 – 5,199 – 1,852,861
At March 31, 2009
Cost 1,296,938 516,352 272,922 17,000 106,620 78,337 2,288,169
Accumulated amortization and
impairment losses – 136,352 102,198 17,000 101,421 78,337 435,308
Net book amount 1,296,938 380,000 170,724 – 5,199 – 1,852,861