Lenovo 2009 Annual Report Download - page 123
Download and view the complete annual report
Please find page 123 of the 2009 Lenovo annual report below. You can navigate through the pages in the report by either clicking on the pages listed below, or by using the keyword search tool below to find specific information within the annual report.-
 1
1 -
2
-
3
-
4
-
5
-
6
-
7
-
8
-
9
-
10
-
11
-
12
-
13
-
14
-
15
-
16
-
17
-
18
-
19
-
20
-
21
-
22
-
23
-
24
-
25
-
26
-
27
-
28
-
29
-
30
-
31
-
32
-
33
-
34
-
35
-
36
-
37
-
38
-
39
-
40
-
41
-
42
-
43
-
44
-
45
-
46
-
47
-
48
-
49
-
50
-
51
-
52
-
53
-
54
-
55
-
56
-
57
-
58
-
59
-
60
-
61
-
62
-
63
-
64
-
65
-
66
-
67
-
68
-
69
-
70
-
71
-
72
-
73
-
74
-
75
-
76
-
77
-
78
-
79
-
80
-
81
-
82
-
83
-
84
-
85
-
86
-
87
-
88
-
89
-
90
-
91
-
92
-
93
-
94
-
95
-
96
-
97
-
98
-
99
-
100
-
101
-
102
-
103
-
104
-
105
-
106
-
107
-
108
-
109
-
110
-
111
-
112
-
 113
113 -
 114
114 -
 115
115 -
 116
116 -
 117
117 -
 118
118 -
 119
119 -
 120
120 -
 121
121 -
 122
122 -
 123
123 -
 124
124 -
 125
125 -
 126
126 -
 127
127 -
 128
128 -
 129
129 -
 130
130 -
 131
131 -
 132
132 -
 133
133 -
134
-
135
-
136
-
137
-
138
-
139
-
140
-
141
-
142
-
143
-
144
-
145
-
146
-
147
-
148
-
149
-
150
-
151
-
152
-
153
-
154
-
155
-
156
 |
 |

2008/09 Annual Report Lenovo Group Limited
121
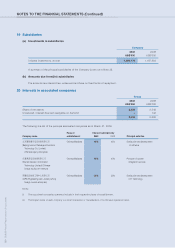
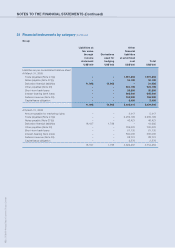
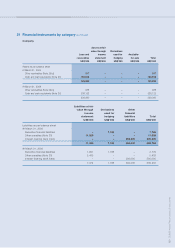
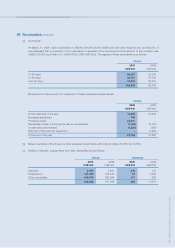
21 Financial instruments by category
Group
Assets at
fair value
through Derivatives
Loan and income used for Available-
receivables statement hedging for-sale Total
US$’000 US$’000 US$’000 US$’000 US$’000
Assets as per consolidated balance sheet
At March 31, 2009
Available-for-sale financial assets (Note 23) – – – 101,916 101,916
Derivative financial assets – 10,676 2,487 – 13,163
Trade receivables (Note 25(a)) 728,387 – – – 728,387
Notes receivable (Note 25(b)) 82,927 – – – 82,927
Other receivables (Note 25(c)) 413,310 – – – 413,310
Cash and cash equivalents (Note 26) 1,863,379 – – – 1,863,379
3,088,003 10,676 2,487 101,916 3,203,082
At March 31, 2008
Available-for-sale financial assets (Note 23) – – – 67,697 67,697
Derivative financial assets – 3,392 – – 3,392
Trade receivables (Note 25(a)) 860,543 – – – 860,543
Notes receivable (Note 25(b)) 371,126 – – – 371,126
Other receivables (Note 25(c)) 582,094 – – – 582,094
Bank deposits (Note 26) 540,058 – – – 540,058
Cash and cash equivalents (Note 26) 1,651,420 – – – 1,651,420
4,005,241 3,392 – 67,697 4,076,330