Lenovo 2009 Annual Report Download - page 81
Download and view the complete annual report
Please find page 81 of the 2009 Lenovo annual report below. You can navigate through the pages in the report by either clicking on the pages listed below, or by using the keyword search tool below to find specific information within the annual report.-
 1
1 -
2
-
3
-
4
-
5
-
6
-
7
-
8
-
9
-
10
-
11
-
12
-
13
-
14
-
15
-
16
-
17
-
18
-
19
-
20
-
21
-
22
-
23
-
24
-
25
-
26
-
27
-
28
-
29
-
30
-
31
-
32
-
33
-
34
-
35
-
36
-
37
-
38
-
39
-
40
-
41
-
42
-
43
-
44
-
45
-
46
-
47
-
48
-
49
-
50
-
51
-
52
-
53
-
54
-
55
-
56
-
57
-
58
-
59
-
60
-
61
-
62
-
63
-
64
-
65
-
66
-
67
-
68
-
69
-
70
-
 71
71 -
 72
72 -
 73
73 -
 74
74 -
 75
75 -
 76
76 -
 77
77 -
 78
78 -
 79
79 -
 80
80 -
 81
81 -
 82
82 -
 83
83 -
 84
84 -
 85
85 -
 86
86 -
 87
87 -
 88
88 -
 89
89 -
 90
90 -
 91
91 -
92
-
93
-
94
-
95
-
96
-
97
-
98
-
99
-
100
-
101
-
102
-
103
-
104
-
105
-
106
-
107
-
108
-
109
-
110
-
111
-
112
-
113
-
114
-
115
-
116
-
117
-
118
-
119
-
120
-
121
-
122
-
123
-
124
-
125
-
126
-
127
-
128
-
129
-
130
-
131
-
132
-
133
-
134
-
135
-
136
-
137
-
138
-
139
-
140
-
141
-
142
-
143
-
144
-
145
-
146
-
147
-
148
-
149
-
150
-
151
-
152
-
153
-
154
-
155
-
156
 |
 |

2008/09 Annual Report Lenovo Group Limited
79
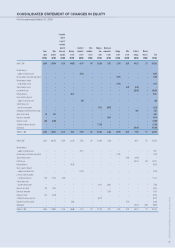
CONSOLIDATED STATEMENT OF CHANGES IN EQUITY
For the year ended March 31, 2009
Convertible
rights in
respect of
convertible
preferred Investment Share Employee Share-based
Share Share shares and Exchange revaluation redemption share compensation Hedging Other Retained Minority
capital premium warrants reserve reserve reserve trusts reserve reserve reserve earnings interests Total
US$’000 US$’000 US$’000 US$’000 US$’000 US$’000 US$’000 US$’000 US$’000 US$’000 US$’000 US$’000 US$’000
At April 1, 2008 29,699 1,150,684 42,159 (66,660) 41,136 497 (172,235) 78,737 (1,788) 24,537 486,323 174 1,613,263
Fair value change on
available-for-sale financial assets – – – – 34,830 – – – – – – – 34,830
Fair value change on interest rate swap contracts – – – – – – – – (5,977) – – – (5,977)
Fair value change on forward
foreign exchange contracts – – – – – – – – (8,811) – – – (8,811)
Transfer to statutory reserve – – – – – – – – – 6,201 (6,201) – –
(Loss)/profit for the year – – – – – – – – – – (226,392) 3 (226,389)
Exchange differences – – – 92,351 – – – – – – – – 92,351
Reserve realized on disposal of
available-for-sale financial assets – – – – (465) – – – – – – – (465)
Vesting of shares under
long-term incentive program – – – – – – 31,943 (40,167) – – – – (8,224)
Actuarial gain from defined benefit pension plans – – – – – – – – – – 7,025 – 7,025
Exercise of share options 80 9,353 – – – – – – – – – – 9,433
Share-based compensation – – – – – – – 54,114 – – – – 54,114
Repurchase of shares (249) (53,658) – – – – – – – – – – (53,907)
Contribution to employee share trusts – – – – – – (17,169) – – – – – (17,169)
Dividends paid – – – – – – – – – – (179,159) – (179,159)
At March 31, 2009 29,530 1,106,379 42,159 25,691 75,501 497 (157,461) 92,684 (16,576) 30,738 81,596 177 1,310,915
At April 1, 2007 28,504 1,042,579 45,979 (22,756) 15,078 497 (127,301) 51,420 – – 99,532 744 1,134,276
Fair value change on
available-for-sale financial assets – – – – 37,651 – – – – – – – 37,651
Fair value change on interest rate swap contracts – – – – – – – – (1,788) – – – (1,788)
Transfer to statutory reserve – – – – – – – – – 31,849 (31,849) – –
Profit for the year – – – – – – – – – 484,263 894 485,157
Exchange differences – – – (38,278) – – – – – – – – (38,278)
Reserve realized on disposal of
available-for-sale financial assets – – – – (11,593) – – – – – – – (11,593)
Conversion of Series A cumulative
convertible preferred shares 1,130 115,924 (3,820) – – – – – – – – – 113,234
Vesting of shares under
long-term incentive program – – – – – – 18,243 (26,011) – – – – (7,768)
Exercise of share options 290 34,539 – – – – – – – – – 34,829
Share-based compensation – – – – – – – 53,328 – – – – 53,328
Repurchase of shares (225) (42,358) – – – – – – – – – – (42,583)
Contribution to employee share trusts – – – – – – (63,177) (63,177)
Disposal of discontinued operations – – – (5,626) – – – – – (7,312) – – (12,938)
Dividends paid – – – – – – – – – – (65,623) (1,464) (67,087)
At March 31, 2008 29,699 1,150,684 42,159 (66,660) 41,136 497 (172,235) 78,737 (1,788) 24,537 486,323 174 1,613,263