Lenovo 2009 Annual Report Download - page 29
Download and view the complete annual report
Please find page 29 of the 2009 Lenovo annual report below. You can navigate through the pages in the report by either clicking on the pages listed below, or by using the keyword search tool below to find specific information within the annual report.-
 1
1 -
2
-
3
-
4
-
5
-
6
-
7
-
8
-
9
-
10
-
11
-
12
-
13
-
14
-
15
-
16
-
17
-
18
-
 19
19 -
 20
20 -
 21
21 -
 22
22 -
 23
23 -
 24
24 -
 25
25 -
 26
26 -
 27
27 -
 28
28 -
 29
29 -
 30
30 -
 31
31 -
 32
32 -
 33
33 -
 34
34 -
 35
35 -
 36
36 -
 37
37 -
 38
38 -
 39
39 -
40
-
41
-
42
-
43
-
44
-
45
-
46
-
47
-
48
-
49
-
50
-
51
-
52
-
53
-
54
-
55
-
56
-
57
-
58
-
59
-
60
-
61
-
62
-
63
-
64
-
65
-
66
-
67
-
68
-
69
-
70
-
71
-
72
-
73
-
74
-
75
-
76
-
77
-
78
-
79
-
80
-
81
-
82
-
83
-
84
-
85
-
86
-
87
-
88
-
89
-
90
-
91
-
92
-
93
-
94
-
95
-
96
-
97
-
98
-
99
-
100
-
101
-
102
-
103
-
104
-
105
-
106
-
107
-
108
-
109
-
110
-
111
-
112
-
113
-
114
-
115
-
116
-
117
-
118
-
119
-
120
-
121
-
122
-
123
-
124
-
125
-
126
-
127
-
128
-
129
-
130
-
131
-
132
-
133
-
134
-
135
-
136
-
137
-
138
-
139
-
140
-
141
-
142
-
143
-
144
-
145
-
146
-
147
-
148
-
149
-
150
-
151
-
152
-
153
-
154
-
155
-
156
 |
 |

2008/09 Annual Report Lenovo Group Limited
27
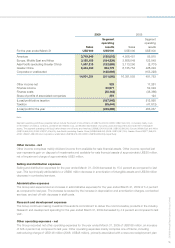
2009 2008
Segment Segment
operating operating
Sales results Sales results
For the year ended March 31 US$’000 US$’000 US$’000 US$’000
Americas 3,749,946 (130,015) 4,506,451 88,915
Europe, Middle East and Africa 3,120,158 (184,239) 3,606,048 122,549
Asia Pacific (excluding Greater China) 1,597,215 (122,889) 2,113,250 (2,701)
Greater China 6,434,032 354,179 6,125,754 426,248
Corporate or unallocated (128,096) (153,228)
14,901,351 (211,060) 16,351,503 481,783
Other income-net 929 17,261
Finance income 59,977 52,048
Finance costs (38,142) (38,366)
Share of profits of associated companies 351 124
(Loss)/profit before taxation (187,945) 512,850
Taxation (38,444) (47,613)
(Loss)/profit for the year (226,389) 465,237
Note:
Segment operating profit/(loss) presented above include the impact of one-off items of US$216,403,000 (2008: US$47,640,000), comprising mainly costs
on termination of onerous contracts, severance and related costs, accelerated depreciation of property, plant and equipment and impairment of intangible
assets. The segment operating profit/(loss) before these one-off items are: Americas (US$68,224,000) (2008: US$105,399,000); Europe, Middle East and Africa
(US$100,560,000) (2008: US$137,406,000); Asia Pacific (excluding Greater China) (US$93,568,000) (2008: US$12,387,000); Greater China US$377,368,000
(2008: US$427,459,000) and corporate or unallocated (US$109,673,000) (2008: (US$153,228,000)) respectively.
Other income - net
Other income comprises mainly dividend income from available-for-sale financial assets. Other income reported last
year represents gain on disposal of investments and available-for-sale financial assets of approximately US$20 million,
net of impairment charge of approximately US$3 million.
Selling and distribution expenses
Selling and distribution expenses for the year ended March 31, 2009 decreased by 15.0 percent as compared to last
year. This is principally attributable to a US$80 million decrease in amortization of intangible assets and US$39 million
decrease in contracted services.
Administrative expenses
The Group also experienced an increase in administrative expenses for the year ended March 31, 2009 of 5.4 percent
as compared to last year. The increase is caused by the increase in depreciation and amortization charges, contracted
services; and set off with decrease in staff costs.
Research and development expenses
The Group continues making investment towards its commitment to deliver the most innovative products in the industry.
Research and development spending for the year ended March 31, 2009 decreased by 4.2 percent as compared to last
year.
Other operating expenses - net
The Group recorded net other operating expenses for the year ended March 31, 2009 of US$166 million, an increase
of 328.4 percent as compared to last year. Other operating expenses mainly comprise one-off items, including
restructuring charge of US$146 million (2008: US$48 million), primarily associated with a resource redeployment plan