Lenovo 2009 Annual Report Download - page 132
Download and view the complete annual report
Please find page 132 of the 2009 Lenovo annual report below. You can navigate through the pages in the report by either clicking on the pages listed below, or by using the keyword search tool below to find specific information within the annual report.-
 1
1 -
2
-
3
-
4
-
5
-
6
-
7
-
8
-
9
-
10
-
11
-
12
-
13
-
14
-
15
-
16
-
17
-
18
-
19
-
20
-
21
-
22
-
23
-
24
-
25
-
26
-
27
-
28
-
29
-
30
-
31
-
32
-
33
-
34
-
35
-
36
-
37
-
38
-
39
-
40
-
41
-
42
-
43
-
44
-
45
-
46
-
47
-
48
-
49
-
50
-
51
-
52
-
53
-
54
-
55
-
56
-
57
-
58
-
59
-
60
-
61
-
62
-
63
-
64
-
65
-
66
-
67
-
68
-
69
-
70
-
71
-
72
-
73
-
74
-
75
-
76
-
77
-
78
-
79
-
80
-
81
-
82
-
83
-
84
-
85
-
86
-
87
-
88
-
89
-
90
-
91
-
92
-
93
-
94
-
95
-
96
-
97
-
98
-
99
-
100
-
101
-
102
-
103
-
104
-
105
-
106
-
107
-
108
-
109
-
110
-
111
-
112
-
113
-
114
-
115
-
116
-
117
-
118
-
119
-
120
-
121
-
 122
122 -
 123
123 -
 124
124 -
 125
125 -
 126
126 -
 127
127 -
 128
128 -
 129
129 -
 130
130 -
 131
131 -
 132
132 -
 133
133 -
 134
134 -
 135
135 -
 136
136 -
 137
137 -
 138
138 -
 139
139 -
 140
140 -
 141
141 -
 142
142 -
143
-
144
-
145
-
146
-
147
-
148
-
149
-
150
-
151
-
152
-
153
-
154
-
155
-
156
 |
 |
2008/09 Annual Report Lenovo Group Limited
130
NOTES TO THE FINANCIAL STATEMENTS (Continued)
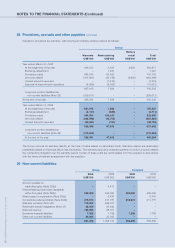
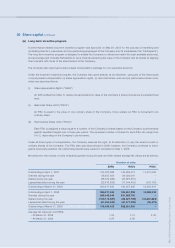
28 Provisions, accruals and other payables (continued)
Included in provisions are warranty, restructuring and battery recall provisions as follows:
Group
Battery
Warranty Restructuring recall Total
US$’000 US$’000 US$’000 US$’000
Year ended March 31, 2008
At the beginning of the year 448,333 5,645 8,693 462,671
Exchange adjustment – 1,227 – 1,227
Provisions made 665,912 50,820 – 716,732
Amounts utilized (411,661) (34,136) (8,693) (454,490)
Unused amounts reversed – (7,616) – (7,616)
Disposal of discontinued operations (4,669) (8,352) – (13,021)
697,915 7,588 – 705,503
Long-term portion classified as
non-current liabilities (Note 29) (209,071) – – (209,071)
At the end of the year 488,844 7,588 – 496,432
Year ended March 31, 2009
At the beginning of the year 697,915 7,588 – 705,503
Exchange adjustment (2,191) (520) – (2,711)
Provisions made 404,564 108,041 – 512,605
Amounts utilized (483,898) (16,755) – (500,653)
Unused amounts reversed (82,991) (751) – (83,742)
533,399 97,603 – 631,002
Long-term portion classified as
non-current liabilities (Note 29) (170,008) – – (170,008)
At the end of the year 363,391 97,603 – 460,994
The Group records its warranty liability at the time of sales based on estimated costs. Warranty claims are reasonably
predictable based on historical failure rate information. The warranty accrual is reviewed quarterly to verify it properly reflects
the outstanding obligation over the warranty period. Certain of these costs are reimbursable from the suppliers in accordance
with the terms of relevant arrangement with the suppliers.
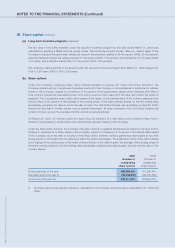
29 Non-current liabilities
Group Company
2009 2008 2009 2008
US$’000 US$’000 US$’000 US$’000
Amount payable for
marketing rights (Note 29(a)) – 5,417 – –
Interest-bearing bank loans repayable
within five years (Note 29(b)) 230,000 465,000 230,000 465,000
Share-based compensation (Note 29(c)) – 6,430 – 6,430
Convertible preferred shares (Note 29(d)) 215,974 211,181 215,974 211,181
Warranty provision (Note 28) 170,008 209,071 – –
Retirement benefit obligations (Note 37) 68,000 85,490 – –
Deferred revenue 165,980 88,701 – –
Derivative financial liabilities 7,382 1,788 7,382 1,788
Other non-current liabilities 33,864 25,045 – –
891,208 1,098,123 453,356 684,399