Lenovo 2009 Annual Report Download - page 127
Download and view the complete annual report
Please find page 127 of the 2009 Lenovo annual report below. You can navigate through the pages in the report by either clicking on the pages listed below, or by using the keyword search tool below to find specific information within the annual report.-
 1
1 -
2
-
3
-
4
-
5
-
6
-
7
-
8
-
9
-
10
-
11
-
12
-
13
-
14
-
15
-
16
-
17
-
18
-
19
-
20
-
21
-
22
-
23
-
24
-
25
-
26
-
27
-
28
-
29
-
30
-
31
-
32
-
33
-
34
-
35
-
36
-
37
-
38
-
39
-
40
-
41
-
42
-
43
-
44
-
45
-
46
-
47
-
48
-
49
-
50
-
51
-
52
-
53
-
54
-
55
-
56
-
57
-
58
-
59
-
60
-
61
-
62
-
63
-
64
-
65
-
66
-
67
-
68
-
69
-
70
-
71
-
72
-
73
-
74
-
75
-
76
-
77
-
78
-
79
-
80
-
81
-
82
-
83
-
84
-
85
-
86
-
87
-
88
-
89
-
90
-
91
-
92
-
93
-
94
-
95
-
96
-
97
-
98
-
99
-
100
-
101
-
102
-
103
-
104
-
105
-
106
-
107
-
108
-
109
-
110
-
111
-
112
-
113
-
114
-
115
-
116
-
 117
117 -
 118
118 -
 119
119 -
 120
120 -
 121
121 -
 122
122 -
 123
123 -
 124
124 -
 125
125 -
 126
126 -
 127
127 -
 128
128 -
 129
129 -
 130
130 -
 131
131 -
 132
132 -
 133
133 -
 134
134 -
 135
135 -
 136
136 -
 137
137 -
138
-
139
-
140
-
141
-
142
-
143
-
144
-
145
-
146
-
147
-
148
-
149
-
150
-
151
-
152
-
153
-
154
-
155
-
156
 |
 |

2008/09 Annual Report Lenovo Group Limited
125
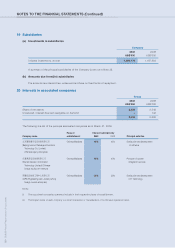
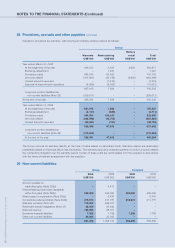
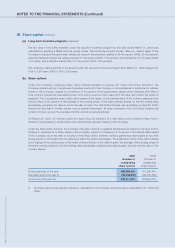
22 Deferred tax assets (continued)
The movements in deferred tax assets and liabilities, analyzed by major component, during the year are as follows:
Tax
Tax depreciation Deferred
Provisions losses allowances revenue Others Total
US$’000 US$’000 US$’000 US$’000 US$’000 US$’000
Year ended March 31, 2008
At the beginning of the year 60,079 7,904 9,852 13,557 10,159 101,551
Reclassification and
exchange adjustments 6,586 2,922 241 1,609 (3,049) 8,309
Credited/(debited) to
consolidated income statement 37,559 (3,168) (4,118) 14,468 6,741 51,482
Disposal of discontinued operations (4,902) – – – – (4,902)
At the end of the year 99,322 7,658 5,975 29,634 13,851 156,440
Year ended March 31, 2009
At the beginning of the year 99,322 7,658 5,975 29,634 13,851 156,440
Reclassification and
exchange adjustments (1,540) (5,695) (2,216) (1,881) (6,501) (17,833)
Credited/(debited) to
consolidated income statement (9,599) 17,556 64 17,713 26,503 52,237
At the end of the year 88,183 19,519 3,823 45,466 33,853 190,844
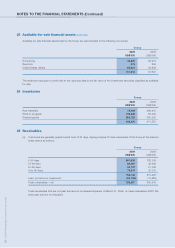
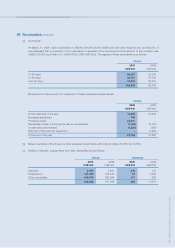
23 Available-for-sale financial assets
Group Company
2009 2008 2009 2008
US$’000 US$’000 US$’000 US$’000
At the beginning of the year 67,697 42,938 – 361
Exchange adjustment 247 214 – –
Net gain transfer to equity 34,365 26,058 – –
Disposals (393) (1,513) – (361)
At the end of the year 101,916 67,697 – –
Group Company
2009 2008 2009 2008
US$’000 US$’000 US$’000 US$’000
Equity securities, at fair value
Listed in Hong Kong 33,215 21,911 – –
Listed outside Hong Kong 66,821 43,928 – –
100,036 65,839 – –
Unlisted 1,880 1,858 – –
101,916 67,697 – –