Lenovo 2009 Annual Report Download - page 141
Download and view the complete annual report
Please find page 141 of the 2009 Lenovo annual report below. You can navigate through the pages in the report by either clicking on the pages listed below, or by using the keyword search tool below to find specific information within the annual report.-
 1
1 -
2
-
3
-
4
-
5
-
6
-
7
-
8
-
9
-
10
-
11
-
12
-
13
-
14
-
15
-
16
-
17
-
18
-
19
-
20
-
21
-
22
-
23
-
24
-
25
-
26
-
27
-
28
-
29
-
30
-
31
-
32
-
33
-
34
-
35
-
36
-
37
-
38
-
39
-
40
-
41
-
42
-
43
-
44
-
45
-
46
-
47
-
48
-
49
-
50
-
51
-
52
-
53
-
54
-
55
-
56
-
57
-
58
-
59
-
60
-
61
-
62
-
63
-
64
-
65
-
66
-
67
-
68
-
69
-
70
-
71
-
72
-
73
-
74
-
75
-
76
-
77
-
78
-
79
-
80
-
81
-
82
-
83
-
84
-
85
-
86
-
87
-
88
-
89
-
90
-
91
-
92
-
93
-
94
-
95
-
96
-
97
-
98
-
99
-
100
-
101
-
102
-
103
-
104
-
105
-
106
-
107
-
108
-
109
-
110
-
111
-
112
-
113
-
114
-
115
-
116
-
117
-
118
-
119
-
120
-
121
-
122
-
123
-
124
-
125
-
126
-
127
-
128
-
129
-
130
-
 131
131 -
 132
132 -
 133
133 -
 134
134 -
 135
135 -
 136
136 -
 137
137 -
 138
138 -
 139
139 -
 140
140 -
 141
141 -
 142
142 -
 143
143 -
 144
144 -
 145
145 -
 146
146 -
 147
147 -
 148
148 -
 149
149 -
 150
150 -
 151
151 -
152
-
153
-
154
-
155
-
156
 |
 |

2008/09 Annual Report Lenovo Group Limited
139
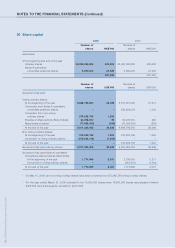
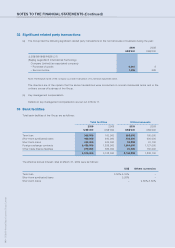
31 Share capital and reserves
The changes in the share capital and reserves of the Company during the year are as follows:
Convertible
rights in
respect of
convertible
preferred
shares Share Investment Share-based
Share Share and Exchange redemption revaluation compensation Hedging Retained
capital premium warrants reserve reserve reserve reserve reserve earnings Total
US$’000 US$’000 US$’000 US$’000 US$’000 US$’000 US$’000 US$’000 US$’000 US$’000
At April 1, 2007 28,504 1,042,579 45,979 (2,497) 497 (181) 51,420 – 394,243 1,560,544
Fair value change
on interest rate swap – – – – – – – (1,788) – (1,788)
Profit for the year – – – – – – – – 466,767 466,767
Exchange differences – – – 5,743 – – – – – 5,743
Reserve realized
on disposal of available-
for-sale financial assets – – – – – 181 – – – 181
Conversion of Series
A cumulative convertible
preferred shares 1,130 115,924 (3,820) – – – – – – 113,234
Vesting of shares under
long-term incentive program – – – – – – (26,011) – – (26,011)
Exercise of share options 290 34,539 – – – – – – – 34,829
Share-based compensation – – – – – – 53,328 – – 53,328
Repurchase of shares (225) (42,358) – – – – – – – (42,583)
Dividends paid – – – – – – – – (68,076) (68,076)
At March 31, 2008 29,699 1,150,684 42,159 3,246 497 – 78,737 (1,788) 792,934 2,096,168
At April 1, 2008 29,699 1,150,684 42,159 3,246 497 – 78,737 (1,788) 792,934 2,096,168
Fair value change
on interest rate swap – – – – – – – (5,977) – (5,977)
Loss for the year – – – – – – – – (59,626) (59,626)
Exchange differences – – – 9,679 – – – – – 9,679
Vesting of shares under
long-term incentive program – – – – – – (40,167) – – (40,167)
Exercise of share options 80 9,353 – – – – – – – 9,433
Share-based compensation – – – – – – 54,114 – – 54,114
Repurchase of shares (249) (53,658) – – – – – – – (53,907)
Dividends paid – – – – – – – – (187,606) (187,606)
At March 31, 2009 29,530 1,106,379 42,159 12,925 497 – 92,684 (7,765) 545,702 1,822,111