Lenovo 2009 Annual Report Download - page 128
Download and view the complete annual report
Please find page 128 of the 2009 Lenovo annual report below. You can navigate through the pages in the report by either clicking on the pages listed below, or by using the keyword search tool below to find specific information within the annual report.-
 1
1 -
2
-
3
-
4
-
5
-
6
-
7
-
8
-
9
-
10
-
11
-
12
-
13
-
14
-
15
-
16
-
17
-
18
-
19
-
20
-
21
-
22
-
23
-
24
-
25
-
26
-
27
-
28
-
29
-
30
-
31
-
32
-
33
-
34
-
35
-
36
-
37
-
38
-
39
-
40
-
41
-
42
-
43
-
44
-
45
-
46
-
47
-
48
-
49
-
50
-
51
-
52
-
53
-
54
-
55
-
56
-
57
-
58
-
59
-
60
-
61
-
62
-
63
-
64
-
65
-
66
-
67
-
68
-
69
-
70
-
71
-
72
-
73
-
74
-
75
-
76
-
77
-
78
-
79
-
80
-
81
-
82
-
83
-
84
-
85
-
86
-
87
-
88
-
89
-
90
-
91
-
92
-
93
-
94
-
95
-
96
-
97
-
98
-
99
-
100
-
101
-
102
-
103
-
104
-
105
-
106
-
107
-
108
-
109
-
110
-
111
-
112
-
113
-
114
-
115
-
116
-
117
-
 118
118 -
 119
119 -
 120
120 -
 121
121 -
 122
122 -
 123
123 -
 124
124 -
 125
125 -
 126
126 -
 127
127 -
 128
128 -
 129
129 -
 130
130 -
 131
131 -
 132
132 -
 133
133 -
 134
134 -
 135
135 -
 136
136 -
 137
137 -
 138
138 -
139
-
140
-
141
-
142
-
143
-
144
-
145
-
146
-
147
-
148
-
149
-
150
-
151
-
152
-
153
-
154
-
155
-
156
 |
 |

2008/09 Annual Report Lenovo Group Limited
126
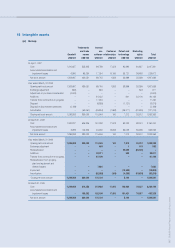
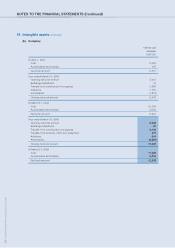
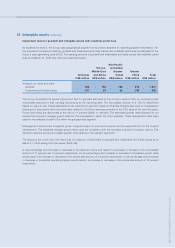
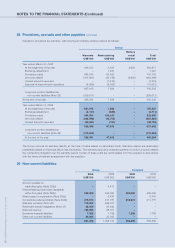
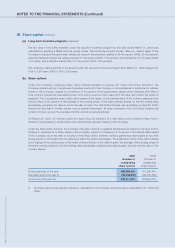
NOTES TO THE FINANCIAL STATEMENTS (Continued)
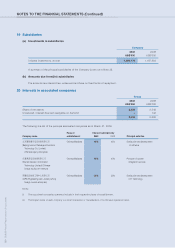
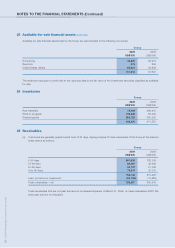
23 Available-for-sale financial assets (continued)
Available-for-sale financial assets held by the Group are denominated in the following currencies:
Group
2009 2008
US$’000 US$’000
Hong Kong 34,220 22,914
Renminbi 875 855
United States dollars 66,821 43,928
101,916 67,697
The maximum exposure to credit risk at the reporting date is the fair value of the investment securities classified as available
for sale.
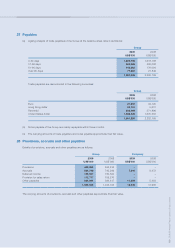
24 Inventories
Group
2009 2008
US$’000 US$’000
Raw materials 72,402 209,815
Work-in-progress 109,246 56,440
Finished goods 268,722 205,302
450,370 471,557
25 Receivables
(a) Customers are generally granted credit term of 30 days. Ageing analysis of trade receivables of the Group at the balance
sheet date is as follows:
Group
2009 2008
US$’000 US$’000
0-30 days 597,933 788,126
31-60 days 63,467 32,240
61-90 days 20,727 21,729
Over 90 days 76,015 32,333
758,142 874,428
Less: provision for impairment (29,755) (13,885)
Trade receivables – net 728,387 860,543
Trade receivables that are not past due are not considered impaired. At March 31, 2009, no trade receivables (2008: Nil)
were past due but not impaired.