Lenovo 2009 Annual Report Download - page 118
Download and view the complete annual report
Please find page 118 of the 2009 Lenovo annual report below. You can navigate through the pages in the report by either clicking on the pages listed below, or by using the keyword search tool below to find specific information within the annual report.-
 1
1 -
2
-
3
-
4
-
5
-
6
-
7
-
8
-
9
-
10
-
11
-
12
-
13
-
14
-
15
-
16
-
17
-
18
-
19
-
20
-
21
-
22
-
23
-
24
-
25
-
26
-
27
-
28
-
29
-
30
-
31
-
32
-
33
-
34
-
35
-
36
-
37
-
38
-
39
-
40
-
41
-
42
-
43
-
44
-
45
-
46
-
47
-
48
-
49
-
50
-
51
-
52
-
53
-
54
-
55
-
56
-
57
-
58
-
59
-
60
-
61
-
62
-
63
-
64
-
65
-
66
-
67
-
68
-
69
-
70
-
71
-
72
-
73
-
74
-
75
-
76
-
77
-
78
-
79
-
80
-
81
-
82
-
83
-
84
-
85
-
86
-
87
-
88
-
89
-
90
-
91
-
92
-
93
-
94
-
95
-
96
-
97
-
98
-
99
-
100
-
101
-
102
-
103
-
104
-
105
-
106
-
107
-
 108
108 -
 109
109 -
 110
110 -
 111
111 -
 112
112 -
 113
113 -
 114
114 -
 115
115 -
 116
116 -
 117
117 -
 118
118 -
 119
119 -
 120
120 -
 121
121 -
 122
122 -
 123
123 -
 124
124 -
 125
125 -
 126
126 -
 127
127 -
 128
128 -
129
-
130
-
131
-
132
-
133
-
134
-
135
-
136
-
137
-
138
-
139
-
140
-
141
-
142
-
143
-
144
-
145
-
146
-
147
-
148
-
149
-
150
-
151
-
152
-
153
-
154
-
155
-
156
 |
 |

2008/09 Annual Report Lenovo Group Limited
116
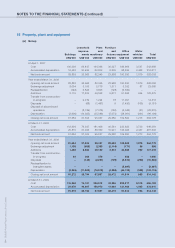
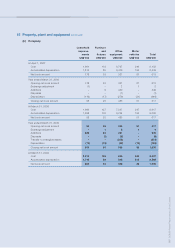
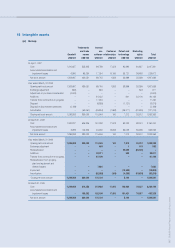
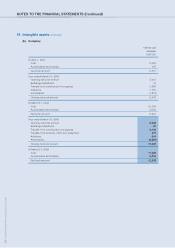
NOTES TO THE FINANCIAL STATEMENTS (Continued)
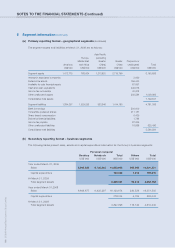
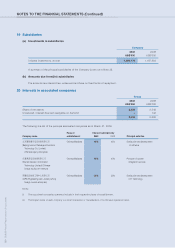
16 Prepaid lease payments
Group
2009 2008
US$’000 US$’000
At the beginning of the year 6,099 5,807
Exchange adjustment 159 588
Disposals (271) (146)
Amortization (154) (150)
At the end of the year 5,833 6,099
Prepaid lease payments represent the payments for land use rights held by the Group in the Chinese Mainland under medium
leases (less than 50 years but not less than 10 years).
17 Construction-in-progress
Group Company
Buildings under
construction Internal use software Others Total Internal use software
2009 2008 2009 2008 2009 2008 2009 2008 2009 2008
US$’000 US$’000 US$’000 US$’000 US$’000 US$’000 US$’000 US$’000 US$’000 US$’000
At the beginning of the year 871 1,032 49,307 16,868 1,059 2,538 51,237 20,438 13,893 16,500
Exchange adjustment 6 110 18 117 2 299 26 526 20 74
Reclassification – (262) 908 43 (908) 219 – – – –
Additions 1,846 3,029 61,032 50,015 1,110 14,098 63,988 67,142 – 187
Transfer to property, plant and equipment (565) (2,094) – – (515) (12,318) (1,080) (14,412) – –
Transfer to intangible assets – – (67,109) (17,494) – – (67,109) (17,494) (6,133) (2,868)
Disposals – (944) – (121) – (3,777) – (4,842) – –
Disposal of discontinued operations – – – (121) – – – (121) – –
At the end of the year 2,158 871 44,156 49,307 748 1,059 47,062 51,237 7,780 13,893
No interest expenses were capitalized in construction-in-progress as at March 31, 2008 and 2009.