Lenovo 2009 Annual Report Download - page 147
Download and view the complete annual report
Please find page 147 of the 2009 Lenovo annual report below. You can navigate through the pages in the report by either clicking on the pages listed below, or by using the keyword search tool below to find specific information within the annual report.-
 1
1 -
2
-
3
-
4
-
5
-
6
-
7
-
8
-
9
-
10
-
11
-
12
-
13
-
14
-
15
-
16
-
17
-
18
-
19
-
20
-
21
-
22
-
23
-
24
-
25
-
26
-
27
-
28
-
29
-
30
-
31
-
32
-
33
-
34
-
35
-
36
-
37
-
38
-
39
-
40
-
41
-
42
-
43
-
44
-
45
-
46
-
47
-
48
-
49
-
50
-
51
-
52
-
53
-
54
-
55
-
56
-
57
-
58
-
59
-
60
-
61
-
62
-
63
-
64
-
65
-
66
-
67
-
68
-
69
-
70
-
71
-
72
-
73
-
74
-
75
-
76
-
77
-
78
-
79
-
80
-
81
-
82
-
83
-
84
-
85
-
86
-
87
-
88
-
89
-
90
-
91
-
92
-
93
-
94
-
95
-
96
-
97
-
98
-
99
-
100
-
101
-
102
-
103
-
104
-
105
-
106
-
107
-
108
-
109
-
110
-
111
-
112
-
113
-
114
-
115
-
116
-
117
-
118
-
119
-
120
-
121
-
122
-
123
-
124
-
125
-
126
-
127
-
128
-
129
-
130
-
131
-
132
-
133
-
134
-
135
-
136
-
 137
137 -
 138
138 -
 139
139 -
 140
140 -
 141
141 -
 142
142 -
 143
143 -
 144
144 -
 145
145 -
 146
146 -
 147
147 -
 148
148 -
 149
149 -
 150
150 -
 151
151 -
 152
152 -
 153
153 -
 154
154 -
 155
155 -
 156
156
 |
 |

2008/09 Annual Report Lenovo Group Limited
145
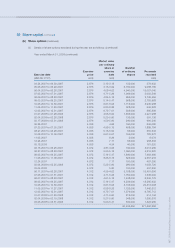
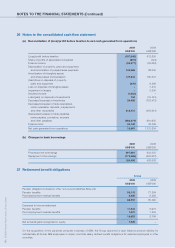
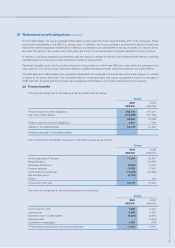
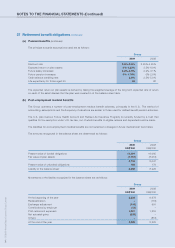
37 Retirement benefit obligations (continued)
(b) Post-employment medical benefits (continued)
The amounts recognized in the income statement are as follows:
Group
2009 2008
US$’000 US$’000
Current service cost 1,650 1,765
Interest cost 739 638
Expected return on plan assets (217) (334)
Net actuarial losses – 487
Curtailment gain (1,151) (1,303)
Total expense recognized in income statement 1,021 1,253
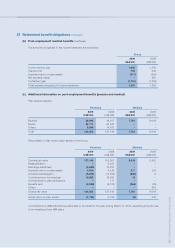
(c) Additional information on post-employment benefits (pension and medical)
Plan assets comprise:
Pensions Medical
2009 2008 2009 2008
US$’000 US$’000 US$’000 US$’000
Equities 36,245 49,977 7,761 8,018
Bonds 88,711 62,978 – –
Others 9,896 14,187 – –
Total 134,852 127,142 7,761 8,018
Reconciliation of fair value of plan assets of the Group:
Pensions Medical
2009 2008 2009 2008
US$’000 US$’000 US$’000 US$’000
Opening fair value 127,142 103,907 8,018 6,920
Reclassification – 2,925 – –
Exchange adjustment (3,840) 15,837 – –
Expected return on plan assets 4,066 4,219 217 334
Actuarial (losses)/gains (5,800) (11,384) (223) 9
Contributions by the employer 19,823 19,595 13 –
Contributions by plan participants – 117 – –
Benefits paid (6,539) (8,074) (264) (63)
Others – – – 818
Closing fair value 134,852 127,142 7,761 8,018
Actual return on plan assets (1,734) (7,165) (6) 343
Contributions of US$5,022,000 are estimated to be made for the year ending March 31, 2010, excluding amounts due
to be transferred from IBM plans.