Lenovo 2009 Annual Report Download - page 105
Download and view the complete annual report
Please find page 105 of the 2009 Lenovo annual report below. You can navigate through the pages in the report by either clicking on the pages listed below, or by using the keyword search tool below to find specific information within the annual report.-
 1
1 -
2
-
3
-
4
-
5
-
6
-
7
-
8
-
9
-
10
-
11
-
12
-
13
-
14
-
15
-
16
-
17
-
18
-
19
-
20
-
21
-
22
-
23
-
24
-
25
-
26
-
27
-
28
-
29
-
30
-
31
-
32
-
33
-
34
-
35
-
36
-
37
-
38
-
39
-
40
-
41
-
42
-
43
-
44
-
45
-
46
-
47
-
48
-
49
-
50
-
51
-
52
-
53
-
54
-
55
-
56
-
57
-
58
-
59
-
60
-
61
-
62
-
63
-
64
-
65
-
66
-
67
-
68
-
69
-
70
-
71
-
72
-
73
-
74
-
75
-
76
-
77
-
78
-
79
-
80
-
81
-
82
-
83
-
84
-
85
-
86
-
87
-
88
-
89
-
90
-
91
-
92
-
93
-
94
-
 95
95 -
 96
96 -
 97
97 -
 98
98 -
 99
99 -
 100
100 -
 101
101 -
 102
102 -
 103
103 -
 104
104 -
 105
105 -
 106
106 -
 107
107 -
 108
108 -
 109
109 -
 110
110 -
 111
111 -
 112
112 -
 113
113 -
 114
114 -
 115
115 -
116
-
117
-
118
-
119
-
120
-
121
-
122
-
123
-
124
-
125
-
126
-
127
-
128
-
129
-
130
-
131
-
132
-
133
-
134
-
135
-
136
-
137
-
138
-
139
-
140
-
141
-
142
-
143
-
144
-
145
-
146
-
147
-
148
-
149
-
150
-
151
-
152
-
153
-
154
-
155
-
156
 |
 |

2008/09 Annual Report Lenovo Group Limited
103
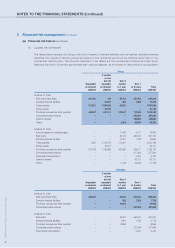
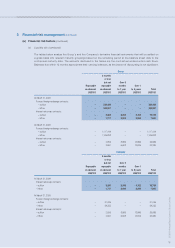
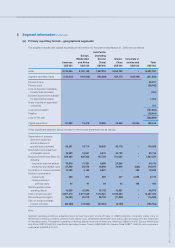
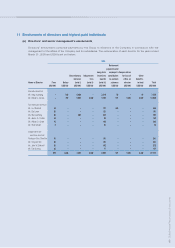
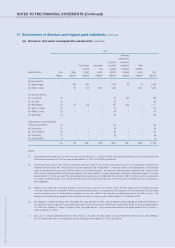
5 Segment information (continued)
(a) Primary reporting format – geographical segments
The segment results and capital expenditure information for the year ended March 31, 2009 are as follows:
Asia Pacific
Europe, (excluding
Middle East Greater Greater Corporate or
Americas and Africa China) China unallocated Total
US$’000 US$’000 US$’000 US$’000 US$’000 US$’000
Sales 3,749,946 3,120,158 1,597,215 6,434,032 – 14,901,351
Segment operating results (130,015) (184,239) (122,889) 354,179 (128,096) (211,060)
Finance income 59,977
Finance costs (38,142)
Loss on disposal of available-
for-sale financial assets (124)
Dividend income from available-
for-sale financial assets 1,053
Share of profits of associated
companies 351
Loss before taxation (187,945)
Taxation (38,444)
Loss for the year (226,389)
Capital expenditure 51,393 15,479 19,088 44,960 62,995 193,915
Other significant segment items included in the income statement are as follows:
Depreciation of property,
plant and equipment
and amortization of
prepaid lease payments 59,351 10,714 38,026 35,178 – 143,269
Amortization and impairment
of intangible assets 16,382 13,631 6,978 46,738 – 83,729
Employee benefit costs (Note 10), 354,909 339,535 167,739 375,067 – 1,237,250
including
– long-term incentive awards 13,618 11,331 5,800 23,365 – 54,114
– severance and related costs 27,803 54,679 15,069 19,049 (523) 116,077
Termination of onerous contracts 10,003 4,186 5,387 – 420 19,996
Auditors’ remuneration
– Current year 439 974 965 427 2,365 5,170
– Underprovision in
previous years 34 91 93 43 189 450
Rental expenses under
operating leases 10,509 12,244 12,702 10,521 – 45,976
Cost of inventories sold 2,961,610 2,577,009 1,210,621 5,738,336 – 12,487,576
Net exchange loss/(gain) 29,006 80,078 25,708 (17,860) – 116,932
Gain on foreign exchange
forward contracts (20,663) (73,630) (37,301) (4,189) – (135,783)
Note:
Segment operating profit/(loss) presented above include the impact of one-off items of US$216,403,000, comprising mainly costs on
termination of onerous contracts, severance and related costs, accelerated depreciation of property, plant and equipment and impairment
of intangible assets. The segment operating profit/(loss) before these one-off items are: Americas (US$68,224,000); Europe, Middle East
and Africa (US$100,560,000); Asia Pacific (excluding Greater China) (US$93,568,000); Greater China US$377,368,000; and corporate or
unallocated (US$109,673,000).