Lenovo 2009 Annual Report Download - page 69
Download and view the complete annual report
Please find page 69 of the 2009 Lenovo annual report below. You can navigate through the pages in the report by either clicking on the pages listed below, or by using the keyword search tool below to find specific information within the annual report.-
 1
1 -
2
-
3
-
4
-
5
-
6
-
7
-
8
-
9
-
10
-
11
-
12
-
13
-
14
-
15
-
16
-
17
-
18
-
19
-
20
-
21
-
22
-
23
-
24
-
25
-
26
-
27
-
28
-
29
-
30
-
31
-
32
-
33
-
34
-
35
-
36
-
37
-
38
-
39
-
40
-
41
-
42
-
43
-
44
-
45
-
46
-
47
-
48
-
49
-
50
-
51
-
52
-
53
-
54
-
55
-
56
-
57
-
58
-
 59
59 -
 60
60 -
 61
61 -
 62
62 -
 63
63 -
 64
64 -
 65
65 -
 66
66 -
 67
67 -
 68
68 -
 69
69 -
 70
70 -
 71
71 -
 72
72 -
 73
73 -
 74
74 -
 75
75 -
 76
76 -
 77
77 -
 78
78 -
 79
79 -
80
-
81
-
82
-
83
-
84
-
85
-
86
-
87
-
88
-
89
-
90
-
91
-
92
-
93
-
94
-
95
-
96
-
97
-
98
-
99
-
100
-
101
-
102
-
103
-
104
-
105
-
106
-
107
-
108
-
109
-
110
-
111
-
112
-
113
-
114
-
115
-
116
-
117
-
118
-
119
-
120
-
121
-
122
-
123
-
124
-
125
-
126
-
127
-
128
-
129
-
130
-
131
-
132
-
133
-
134
-
135
-
136
-
137
-
138
-
139
-
140
-
141
-
142
-
143
-
144
-
145
-
146
-
147
-
148
-
149
-
150
-
151
-
152
-
153
-
154
-
155
-
156
 |
 |

2008/09 Annual Report Lenovo Group Limited
67
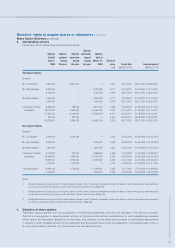
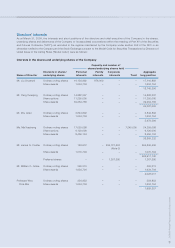
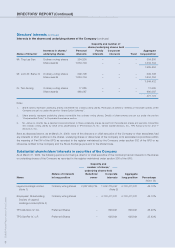
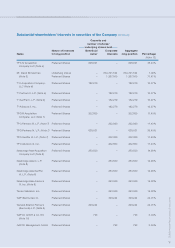
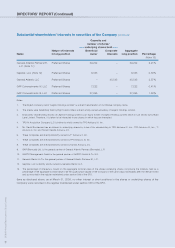
Substantial shareholders’ interests in securities of the Company (continued)
Capacity and
number of shares/
underlying shares held
Nature of interests Beneficial Corporate Aggregate
Name in long position owner interests long position Percentage
(Note 13)
TPG IV Acquisition Preferred Shares 628,921 – 628,921 35.43%
Company LLC (Note 4)
Mr. David Bonderman Underlying shares – 634,721,524 634,721,524 7.09%
(Note 5) Preferred Shares – 1,267,500 1,267,500 71.41%
T3 II Acquisition Company, Preferred Shares 182,279 – 182,279 10.27%
LLC (Note 6)
T3 Partners II, L.P. (Note 6) Preferred Shares – 182,279 182,279 10.27%
T3 GenPar II, L.P. (Note 6) Preferred Shares – 182,279 182,279 10.27%
T3 Advisors II, Inc. Preferred Shares – 182,279 182,279 10.27%
TPG III Acquisition Preferred Shares 202,800 – 202,800 11.43%
Company, LLC (Note 7)
TPG Partners III, L.P. (Note 7) Preferred Shares – 202,800 202,800 11.43%
TPG Partners IV, L.P. (Note 7) Preferred Shares 628,921 – 628,921 35.43%
TPG GenPar III, L.P. (Note 7) Preferred Shares – 202,800 202,800 11.43%
TPG Advisors III, Inc. Preferred Shares – 202,800 202,800 11.43%
Newbridge Asia Acquisition Preferred Shares 253,500 – 253,500 14.28%
Company LLC (Note 8)
Newbridge Asia III, L.P. Preferred Shares – 253,500 253,500 14.28%
(Note 8)
Newbridge Asia GenPar Preferred Shares – 253,500 253,500 14.28%
III, L.P. (Note 8)
Newbridge Asia Advisors Preferred Shares – 253,500 253,500 14.28%
III, Inc. (Note 8)
Tarrant Advisors, Inc. Preferred Shares – 253,500 253,500 14.28%
GAP (Bermuda) Ltd. Preferred Shares – 426,244 426,244 24.01%
General Atlantic Partners Preferred Shares 426,244 – 426,244 24.01%
(Bermuda) L.P. (Note 9)
GAPCO GmbH & Co. KG Preferred Shares 793 – 793 0.04%
(Note 10)
GAPCO Management GmbH Preferred Shares – 793 793 0.04%