Lenovo 2009 Annual Report Download - page 106
Download and view the complete annual report
Please find page 106 of the 2009 Lenovo annual report below. You can navigate through the pages in the report by either clicking on the pages listed below, or by using the keyword search tool below to find specific information within the annual report.-
 1
1 -
2
-
3
-
4
-
5
-
6
-
7
-
8
-
9
-
10
-
11
-
12
-
13
-
14
-
15
-
16
-
17
-
18
-
19
-
20
-
21
-
22
-
23
-
24
-
25
-
26
-
27
-
28
-
29
-
30
-
31
-
32
-
33
-
34
-
35
-
36
-
37
-
38
-
39
-
40
-
41
-
42
-
43
-
44
-
45
-
46
-
47
-
48
-
49
-
50
-
51
-
52
-
53
-
54
-
55
-
56
-
57
-
58
-
59
-
60
-
61
-
62
-
63
-
64
-
65
-
66
-
67
-
68
-
69
-
70
-
71
-
72
-
73
-
74
-
75
-
76
-
77
-
78
-
79
-
80
-
81
-
82
-
83
-
84
-
85
-
86
-
87
-
88
-
89
-
90
-
91
-
92
-
93
-
94
-
95
-
 96
96 -
 97
97 -
 98
98 -
 99
99 -
 100
100 -
 101
101 -
 102
102 -
 103
103 -
 104
104 -
 105
105 -
 106
106 -
 107
107 -
 108
108 -
 109
109 -
 110
110 -
 111
111 -
 112
112 -
 113
113 -
 114
114 -
 115
115 -
 116
116 -
117
-
118
-
119
-
120
-
121
-
122
-
123
-
124
-
125
-
126
-
127
-
128
-
129
-
130
-
131
-
132
-
133
-
134
-
135
-
136
-
137
-
138
-
139
-
140
-
141
-
142
-
143
-
144
-
145
-
146
-
147
-
148
-
149
-
150
-
151
-
152
-
153
-
154
-
155
-
156
 |
 |

2008/09 Annual Report Lenovo Group Limited
104
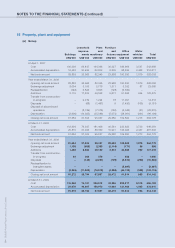
NOTES TO THE FINANCIAL STATEMENTS (Continued)
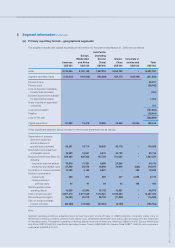
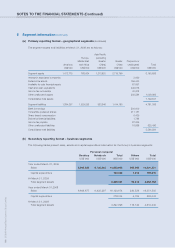
5 Segment information (continued)
(a) Primary reporting format – geographical segments (continued)
The segment assets and liabilities at March 31, 2009 are as follows:
Asia Pacific
Europe, (excluding
Middle East Greater Greater Corporate or
Americas and Africa China) China unallocated Total
US$’000 US$’000 US$’000 US$’000 US$’000 US$’000
Segment assets 1,213,538 574,175 648,134 3,187,615 5,623,462
Interests in associated
companies 2,635
Deferred tax assets 190,844
Available-for-sale financial
assets 101,916
Cash and cash equivalents 145,174
Income tax recoverable 35,301
Other unallocated assets 208,967 684,837
Consolidated total assets 6,308,299
Segment liabilities 1,258,128 1,014,142 418,552 1,527,532 4,218,354
Bank borrowings 465,000
Convertible preferred shares 215,974
Derivative financial liabilities 7,382
Income tax payable 89,459
Other unallocated liabilities 1,215 779,030
Consolidated total liabilities 4,997,384