Lenovo 2009 Annual Report Download - page 107
Download and view the complete annual report
Please find page 107 of the 2009 Lenovo annual report below. You can navigate through the pages in the report by either clicking on the pages listed below, or by using the keyword search tool below to find specific information within the annual report.-
 1
1 -
2
-
3
-
4
-
5
-
6
-
7
-
8
-
9
-
10
-
11
-
12
-
13
-
14
-
15
-
16
-
17
-
18
-
19
-
20
-
21
-
22
-
23
-
24
-
25
-
26
-
27
-
28
-
29
-
30
-
31
-
32
-
33
-
34
-
35
-
36
-
37
-
38
-
39
-
40
-
41
-
42
-
43
-
44
-
45
-
46
-
47
-
48
-
49
-
50
-
51
-
52
-
53
-
54
-
55
-
56
-
57
-
58
-
59
-
60
-
61
-
62
-
63
-
64
-
65
-
66
-
67
-
68
-
69
-
70
-
71
-
72
-
73
-
74
-
75
-
76
-
77
-
78
-
79
-
80
-
81
-
82
-
83
-
84
-
85
-
86
-
87
-
88
-
89
-
90
-
91
-
92
-
93
-
94
-
95
-
96
-
 97
97 -
 98
98 -
 99
99 -
 100
100 -
 101
101 -
 102
102 -
 103
103 -
 104
104 -
 105
105 -
 106
106 -
 107
107 -
 108
108 -
 109
109 -
 110
110 -
 111
111 -
 112
112 -
 113
113 -
 114
114 -
 115
115 -
 116
116 -
 117
117 -
118
-
119
-
120
-
121
-
122
-
123
-
124
-
125
-
126
-
127
-
128
-
129
-
130
-
131
-
132
-
133
-
134
-
135
-
136
-
137
-
138
-
139
-
140
-
141
-
142
-
143
-
144
-
145
-
146
-
147
-
148
-
149
-
150
-
151
-
152
-
153
-
154
-
155
-
156
 |
 |

2008/09 Annual Report Lenovo Group Limited
105
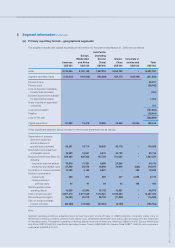
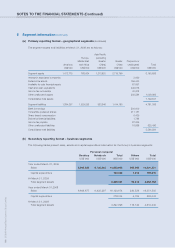
5 Segment information (continued)
(a) Primary reporting format – geographical segments (continued)
The segment results and capital expenditure information for the year ended March 31, 2008 are as follows:
Asia Pacific
Europe, (excluding
Middle East Greater Greater Corporate or
Americas and Africa China) China unallocated Total
US$’000 US$’000 US$’000 US$’000 US$’000 US$’000
Sales 4,506,451 3,606,048 2,113,250 6,125,754 – 16,351,503
Segment operating results 88,915 122,549 (2,701) 426,248 (153,228) 481,783
Finance income 52,048
Finance costs (38,366)
Impairment of assets (2,530)
Gain on disposal of available-
for-sale financial assets 19,791
Share of profits of associated
companies 124
Profit before taxation 512,850
Taxation (47,613)
Profit for the year 465,237
Capital expenditure 53,261 8,259 27,179 78,162 117,182 284,043
Other significant segment items included in the income statement are as follows:
Depreciation of property,
plant and equipment and
amortization of prepaid
lease payments 40,775 9,091 11,320 18,656 8,183 88,025
Amortization of intangible assets – – – 28,140 99,173 127,313
Employee benefit costs (Note 10), 380,105 314,907 191,310 250,901 56,973 1,194,196
including
– long-term incentive awards 14,697 11,761 6,892 19,978 – 53,328
– severance and related costs 12,926 14,955 15,207 982 – 44,070
Termination of onerous
contracts 3,558 (98) (119) 229 – 3,570
Auditors’ remuneration
– Current year 366 981 1,008 463 2,050 4,868
– Underprovision in
previous years 97 260 267 123 542 1,289
Rental expenses under
operating leases 6,628 8,068 10,423 9,429 155 34,703
Cost of inventories sold 3,462,229 2,779,524 1,609,350 5,030,137 – 12,881,240
Impairment of investments – – – – 2,530 2,530
Net exchange (gain)/loss (23,989) (37,100) (29,575) 38,057 – (52,607)
Loss on foreign exchange
forward contracts 15,041 15,474 17,456 1,675 – 49,646
Note:
Segment operating profit/(loss) presented above include the impact of one-off items of US$47,640,000, comprising mainly costs on
termination of onerous contracts, and severance and related costs. The segment operating profit/(loss) before these one-off items are:
Americas US$105,399,000; Europe, Middle East and Africa US$137,406,000; Asia Pacific (excluding Greater China) US$12,387,000;
Greater China US$427,459,000; and corporate or unallocated (US$153,228,000).