Lenovo 2009 Annual Report Download - page 144
Download and view the complete annual report
Please find page 144 of the 2009 Lenovo annual report below. You can navigate through the pages in the report by either clicking on the pages listed below, or by using the keyword search tool below to find specific information within the annual report.-
 1
1 -
2
-
3
-
4
-
5
-
6
-
7
-
8
-
9
-
10
-
11
-
12
-
13
-
14
-
15
-
16
-
17
-
18
-
19
-
20
-
21
-
22
-
23
-
24
-
25
-
26
-
27
-
28
-
29
-
30
-
31
-
32
-
33
-
34
-
35
-
36
-
37
-
38
-
39
-
40
-
41
-
42
-
43
-
44
-
45
-
46
-
47
-
48
-
49
-
50
-
51
-
52
-
53
-
54
-
55
-
56
-
57
-
58
-
59
-
60
-
61
-
62
-
63
-
64
-
65
-
66
-
67
-
68
-
69
-
70
-
71
-
72
-
73
-
74
-
75
-
76
-
77
-
78
-
79
-
80
-
81
-
82
-
83
-
84
-
85
-
86
-
87
-
88
-
89
-
90
-
91
-
92
-
93
-
94
-
95
-
96
-
97
-
98
-
99
-
100
-
101
-
102
-
103
-
104
-
105
-
106
-
107
-
108
-
109
-
110
-
111
-
112
-
113
-
114
-
115
-
116
-
117
-
118
-
119
-
120
-
121
-
122
-
123
-
124
-
125
-
126
-
127
-
128
-
129
-
130
-
131
-
132
-
133
-
 134
134 -
 135
135 -
 136
136 -
 137
137 -
 138
138 -
 139
139 -
 140
140 -
 141
141 -
 142
142 -
 143
143 -
 144
144 -
 145
145 -
 146
146 -
 147
147 -
 148
148 -
 149
149 -
 150
150 -
 151
151 -
 152
152 -
 153
153 -
 154
154 -
155
-
156
 |
 |

2008/09 Annual Report Lenovo Group Limited
142
NOTES TO THE FINANCIAL STATEMENTS (Continued)
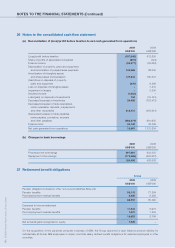
36 Notes to the consolidated cash flow statement
(a) Reconciliation of (loss)/profit before taxation to net cash generated from operations
2009 2008
US$’000 US$’000
(Loss)/profit before taxation (187,945) 512,850
Share of profits of associated companies (351) (124)
Finance income (59,977) (52,048)
Depreciation of property, plant and equipment
and amortization of prepaid lease payments 143,269 88,025
Amortization of intangible assets
and share-based compensation 137,843 180,641
(Gain)/loss on disposal of property,
plant and equipment (276) 8,299
Loss on disposal of intangible assets – 7,210
Impairment of assets – 2,530
Dividend income (1,053) –
Loss/(gain) on disposal of investments 124 (19,791)
Decrease/(increase) in inventories 26,028 (152,473)
Decrease/(increase) in trade receivables,
notes receivable, deposits, prepayments
and other receivables 616,431 (463,631)
(Decrease)/increase in trade payables,
notes payable, provisions, accruals
and other payables (692,274) 981,950
Finance costs 38,142 38,366
Net cash generated from operations 19,961 1,131,804
(b) Changes in bank borrowings
2009 2008
US$’000 US$’000
Proceeds from borrowings 297,061 932,355
Repayment of borrowings (172,568) (503,672)
124,493 428,683
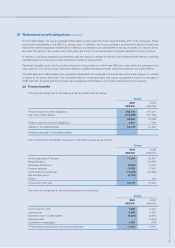
37 Retirement benefit obligations
Group
2009 2008
US$’000 US$’000
Pension obligation included in other non-current liabilities (Note 29)
Pension benefits 59,115 77,264
Post-employment medical benefits 8,885 8,226
68,000 85,490
Expensed in income statement
Pension benefits 11,032 6,931
Post-employment medical benefits 1,021 1,253
12,053 8,184
Net actuarial gains recognized in equity 7,025 –
On the acquisition of the personal computer business of IBM, the Group assumed a cash balance pension liability for
substantially all former IBM employees in Japan, and final salary defined benefit obligations for selected employees in other
countries.