Lenovo 2009 Annual Report Download - page 115
Download and view the complete annual report
Please find page 115 of the 2009 Lenovo annual report below. You can navigate through the pages in the report by either clicking on the pages listed below, or by using the keyword search tool below to find specific information within the annual report.-
 1
1 -
2
-
3
-
4
-
5
-
6
-
7
-
8
-
9
-
10
-
11
-
12
-
13
-
14
-
15
-
16
-
17
-
18
-
19
-
20
-
21
-
22
-
23
-
24
-
25
-
26
-
27
-
28
-
29
-
30
-
31
-
32
-
33
-
34
-
35
-
36
-
37
-
38
-
39
-
40
-
41
-
42
-
43
-
44
-
45
-
46
-
47
-
48
-
49
-
50
-
51
-
52
-
53
-
54
-
55
-
56
-
57
-
58
-
59
-
60
-
61
-
62
-
63
-
64
-
65
-
66
-
67
-
68
-
69
-
70
-
71
-
72
-
73
-
74
-
75
-
76
-
77
-
78
-
79
-
80
-
81
-
82
-
83
-
84
-
85
-
86
-
87
-
88
-
89
-
90
-
91
-
92
-
93
-
94
-
95
-
96
-
97
-
98
-
99
-
100
-
101
-
102
-
103
-
104
-
 105
105 -
 106
106 -
 107
107 -
 108
108 -
 109
109 -
 110
110 -
 111
111 -
 112
112 -
 113
113 -
 114
114 -
 115
115 -
 116
116 -
 117
117 -
 118
118 -
 119
119 -
 120
120 -
 121
121 -
 122
122 -
 123
123 -
 124
124 -
 125
125 -
126
-
127
-
128
-
129
-
130
-
131
-
132
-
133
-
134
-
135
-
136
-
137
-
138
-
139
-
140
-
141
-
142
-
143
-
144
-
145
-
146
-
147
-
148
-
149
-
150
-
151
-
152
-
153
-
154
-
155
-
156
 |
 |

2008/09 Annual Report Lenovo Group Limited
113
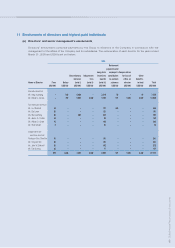
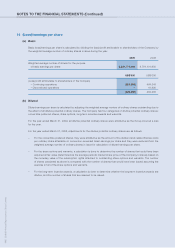
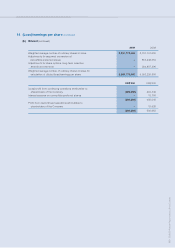
14 (Loss)/earnings per share (continued)
(b) Diluted (continued)
2009 2008
Weighted average number of ordinary shares in issue 8,851,779,460 8,781,101,650
Adjustments for assumed conversion of
convertible preferred shares – 857,246,554
Adjustments for share options, long-term incentive
awards and warrants – 294,887,296
Weighted average number of ordinary shares in issue for
calculation of diluted (loss)/earnings per share 8,851,779,460 9,933,235,500
US$’000 US$’000
(Loss)/profit from continuing operations attributable to
shareholders of the Company (226,392) 464,343
Interest expense on convertible preferred shares – 18,700
(226,392) 483,043
Profit from discontinued operations attributable to
shareholders of the Company – 19,920
(226,392) 502,963