Lenovo 2009 Annual Report Download - page 98
Download and view the complete annual report
Please find page 98 of the 2009 Lenovo annual report below. You can navigate through the pages in the report by either clicking on the pages listed below, or by using the keyword search tool below to find specific information within the annual report.-
 1
1 -
2
-
3
-
4
-
5
-
6
-
7
-
8
-
9
-
10
-
11
-
12
-
13
-
14
-
15
-
16
-
17
-
18
-
19
-
20
-
21
-
22
-
23
-
24
-
25
-
26
-
27
-
28
-
29
-
30
-
31
-
32
-
33
-
34
-
35
-
36
-
37
-
38
-
39
-
40
-
41
-
42
-
43
-
44
-
45
-
46
-
47
-
48
-
49
-
50
-
51
-
52
-
53
-
54
-
55
-
56
-
57
-
58
-
59
-
60
-
61
-
62
-
63
-
64
-
65
-
66
-
67
-
68
-
69
-
70
-
71
-
72
-
73
-
74
-
75
-
76
-
77
-
78
-
79
-
80
-
81
-
82
-
83
-
84
-
85
-
86
-
87
-
 88
88 -
 89
89 -
 90
90 -
 91
91 -
 92
92 -
 93
93 -
 94
94 -
 95
95 -
 96
96 -
 97
97 -
 98
98 -
 99
99 -
 100
100 -
 101
101 -
 102
102 -
 103
103 -
 104
104 -
 105
105 -
 106
106 -
 107
107 -
 108
108 -
109
-
110
-
111
-
112
-
113
-
114
-
115
-
116
-
117
-
118
-
119
-
120
-
121
-
122
-
123
-
124
-
125
-
126
-
127
-
128
-
129
-
130
-
131
-
132
-
133
-
134
-
135
-
136
-
137
-
138
-
139
-
140
-
141
-
142
-
143
-
144
-
145
-
146
-
147
-
148
-
149
-
150
-
151
-
152
-
153
-
154
-
155
-
156
 |
 |

2008/09 Annual Report Lenovo Group Limited
96
NOTES TO THE FINANCIAL STATEMENTS (Continued)
3 Financial risk management (continued)
(a) Financial risk factors (continued)
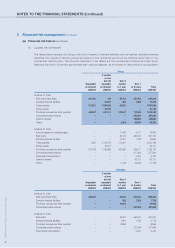
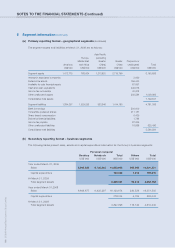
(v) Liquidity risk (continued)
The tables below analyze the Group’s and the Company’s financial liabilities and net-settled derivative financial
liabilities into relevant maturity groupings based on the remaining period at the balance sheet date to the
contractual maturity date. The amounts disclosed in the tables are the contractual undiscounted cash flows.
Balances due within 12 months approximate their carrying balances, as the impact of discounting is not significant.
Group
3 months
or less
but not Over 3
Repayable repayable months Over 1
on demand on demand to 1 year to 5 years Total
US$’000 US$’000 US$’000 US$’000 US$’000
At March 31, 2009
Bank loans (Note 29(b)) 400,000 159 55,134 230,000 685,293
Derivative financial liabilities – 23,291 383 7,382 31,056
Trade payables 371,607 1,584,592 35,087 – 1,991,286
Notes payable – 34,180 – – 34,180
Provisions, accruals and other payables 409,567 627,511 472,847 170,008 1,679,933
Convertible preferred shares – – – 227,564 227,564
Deferred revenue – – – 165,980 165,980
Others – – 2,359 33,864 36,223
At March 31, 2008
Amount payable for marketing rights – – 11,443 5,417 16,860
Bank loans – – 96,130 465,000 561,130
Derivative financial liabilities – – 18,197 1,788 19,985
Trade payables 1,922 2,105,276 175,001 – 2,282,199
Notes payable – 46,421 – – 46,421
Provisions, accruals and other payables 316,183 1,130,886 497,655 209,071 2,153,795
Convertible preferred shares – – – 227,564 227,564
Share-based compensation – – – 6,430 6,430
Deferred revenue – – – 88,701 88,701
Others – – 2,138 25,045 27,183
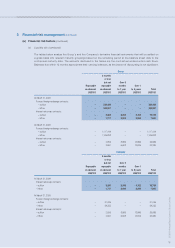
Company
3 months
or less
but not Over 3
Repayable repayable months Over 1
on demand on demand to 1 year to 5 years Total
US$’000 US$’000 US$’000 US$’000 US$’000
At March 31, 2009
Bank loans (Note 29(b)) 400,000 – 35,000 230,000 665,000
Derivative financial liabilities – – 383 7,382 7,765
Provisions, accruals and other payables – – 18,945 – 18,945
Convertible preferred shares – – – 227,564 227,564
At March 31, 2008
Bank loans – – 35,000 465,000 500,000
Derivative financial liabilities – – 1,991 1,788 3,779
Provisions, accruals and other payables – – 13,955 – 13,955
Convertible preferred shares – – – 227,564 227,564
Share-based compensation – – – 6,430 6,430