Lenovo 2009 Annual Report Download - page 135
Download and view the complete annual report
Please find page 135 of the 2009 Lenovo annual report below. You can navigate through the pages in the report by either clicking on the pages listed below, or by using the keyword search tool below to find specific information within the annual report.-
 1
1 -
2
-
3
-
4
-
5
-
6
-
7
-
8
-
9
-
10
-
11
-
12
-
13
-
14
-
15
-
16
-
17
-
18
-
19
-
20
-
21
-
22
-
23
-
24
-
25
-
26
-
27
-
28
-
29
-
30
-
31
-
32
-
33
-
34
-
35
-
36
-
37
-
38
-
39
-
40
-
41
-
42
-
43
-
44
-
45
-
46
-
47
-
48
-
49
-
50
-
51
-
52
-
53
-
54
-
55
-
56
-
57
-
58
-
59
-
60
-
61
-
62
-
63
-
64
-
65
-
66
-
67
-
68
-
69
-
70
-
71
-
72
-
73
-
74
-
75
-
76
-
77
-
78
-
79
-
80
-
81
-
82
-
83
-
84
-
85
-
86
-
87
-
88
-
89
-
90
-
91
-
92
-
93
-
94
-
95
-
96
-
97
-
98
-
99
-
100
-
101
-
102
-
103
-
104
-
105
-
106
-
107
-
108
-
109
-
110
-
111
-
112
-
113
-
114
-
115
-
116
-
117
-
118
-
119
-
120
-
121
-
122
-
123
-
124
-
 125
125 -
 126
126 -
 127
127 -
 128
128 -
 129
129 -
 130
130 -
 131
131 -
 132
132 -
 133
133 -
 134
134 -
 135
135 -
 136
136 -
 137
137 -
 138
138 -
 139
139 -
 140
140 -
 141
141 -
 142
142 -
 143
143 -
 144
144 -
 145
145 -
146
-
147
-
148
-
149
-
150
-
151
-
152
-
153
-
154
-
155
-
156
 |
 |

2008/09 Annual Report Lenovo Group Limited
133
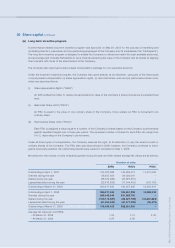
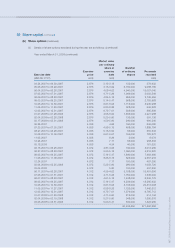
30 Share capital (continued)
(a) Long-term incentive program
A performance-related long-term incentive program was approved on May 26, 2005 for the purpose of rewarding and
motivating directors, executives and top-performing employees of the Company and its subsidiaries (the “Participants”).
The long-term incentive program is designed to enable the Company to attract and retain the best available personnel,
and encourage and motivate Participants to work towards enhancing the value of the Company and its shares by aligning
their interests with those of the shareholders of the Company.
The Company also approved a share-based compensation package for non-executive directors.
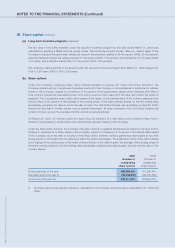
Under the long-term incentive program, the Company may grant awards, at its discretion, using any of the three types
of equity-based compensation: (i) share appreciation rights, (ii) restricted share units and (iii) performance share units,
which are described below:
(i) Share Appreciation Rights (“SARs”)
An SAR entitles the holder to receive the appreciation in value of the Company’s share price above a predetermined
level.
(ii) Restricted Share Units (“RSUs”)
An RSU is equal to the value of one ordinary share of the Company. Once vested, an RSU is converted to an
ordinary share.
(iii) Performance Share Units (“PSUs”)
Each PSU is assigned a value equal to a number of the Company’s shares based on the Company’s performance
against specified targets over a three-year period. The equivalent number of shares for each PSU can range from
0 to 2, depending on the Company’s performance.
Under all three types of compensation, the Company reserves the right, at its discretion, to pay the award in cash or
ordinary shares of the Company. The PSU plan was discontinued in 2006; however, the Company continues to honor
grants previously awarded. All outstanding awards were vested or cancelled on May 1, 2008.
Movements in the number of units of awards granted during the year and their related average fair values are as follows:
Number of units
SARs RSUs PSUs
Outstanding at April 1, 2007 312,027,688 146,896,513 11,313,048
Granted during the year 98,847,054 94,393,041 –
Vested during the year (88,579,926) (35,687,810) –
Lapsed/cancelled during the year (22,476,983) (11,344,452) (330,130)
Outstanding at March 31, 2008 299,817,833 194,257,292 10,982,918
Outstanding at April 1, 2008 299,817,833 194,257,292 10,982,918
Granted during the year 290,145,645 231,923,705 –
Vested during the year (125,173,097) (82,027,769) (10,887,843)
Lapsed/cancelled during the year (51,354,953) (61,471,698) (95,075)
Outstanding at March 31, 2009 413,435,428 282,681,530 –
Average fair value per unit (HK$)
– At March 31, 2008 1.05 3.31 2.39
– At March 31, 2009 0.97 2.80 –