Lenovo 2009 Annual Report Download - page 79
Download and view the complete annual report
Please find page 79 of the 2009 Lenovo annual report below. You can navigate through the pages in the report by either clicking on the pages listed below, or by using the keyword search tool below to find specific information within the annual report.-
 1
1 -
2
-
3
-
4
-
5
-
6
-
7
-
8
-
9
-
10
-
11
-
12
-
13
-
14
-
15
-
16
-
17
-
18
-
19
-
20
-
21
-
22
-
23
-
24
-
25
-
26
-
27
-
28
-
29
-
30
-
31
-
32
-
33
-
34
-
35
-
36
-
37
-
38
-
39
-
40
-
41
-
42
-
43
-
44
-
45
-
46
-
47
-
48
-
49
-
50
-
51
-
52
-
53
-
54
-
55
-
56
-
57
-
58
-
59
-
60
-
61
-
62
-
63
-
64
-
65
-
66
-
67
-
68
-
 69
69 -
 70
70 -
 71
71 -
 72
72 -
 73
73 -
 74
74 -
 75
75 -
 76
76 -
 77
77 -
 78
78 -
 79
79 -
 80
80 -
 81
81 -
 82
82 -
 83
83 -
 84
84 -
 85
85 -
 86
86 -
 87
87 -
 88
88 -
 89
89 -
90
-
91
-
92
-
93
-
94
-
95
-
96
-
97
-
98
-
99
-
100
-
101
-
102
-
103
-
104
-
105
-
106
-
107
-
108
-
109
-
110
-
111
-
112
-
113
-
114
-
115
-
116
-
117
-
118
-
119
-
120
-
121
-
122
-
123
-
124
-
125
-
126
-
127
-
128
-
129
-
130
-
131
-
132
-
133
-
134
-
135
-
136
-
137
-
138
-
139
-
140
-
141
-
142
-
143
-
144
-
145
-
146
-
147
-
148
-
149
-
150
-
151
-
152
-
153
-
154
-
155
-
156
 |
 |
2008/09 Annual Report Lenovo Group Limited
77
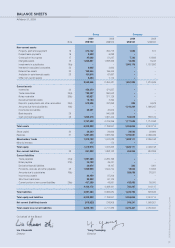
BALANCE SHEETS
At March 31, 2009
Group Company
2009 2008 2009 2008
Note US$’000 US$’000 US$’000 US$’000
Non-current assets
Property, plant and equipment 15 314,142 364,778 1,035 617
Prepaid lease payments 16 5,833 6,099 – –
Construction-in-progress 17 47,062 51,237 7,780 13,893
Intangible assets 18 1,852,861 1,838,368 12,235 8,243
Investments in subsidiaries 19(a) – – 1,860,176 1,187,893
Interests in associated companies 20 2,635 2,690 – –
Deferred tax assets 22 190,844 156,440 – –
Available-for-sale financial assets 23 101,916 67,697 – –
Other non-current assets 5,653 7,172 – –
2,520,946 2,494,481 1,881,226 1,210,646
Current assets
Inventories 24 450,370 471,557 – –
Trade receivables 25(a) 728,387 860,543 – –
Notes receivable 25(b) 82,927 371,126 – –
Derivative financial assets 13,163 3,392 – –
Deposits, prepayments and other receivables 25(c) 613,826 767,268 596 6,679
Amounts due from subsidiaries 19(b) – – 1,013,394 1,369,267
Income tax recoverable 35,301 40,002 – –
Bank deposits 26 – 540,058 – –
Cash and cash equivalents 26 1,863,379 1,651,420 163,618 338,122
3,787,353 4,705,366 1,177,608 1,714,068
Total assets 6,308,299 7,199,847 3,058,834 2,924,714
Share capital 30 29,530 29,699 29,530 29,699
Reserves 31 1,281,208 1,583,390 1,792,581 2,066,469
Shareholders’ funds 1,310,738 1,613,089 1,822,111 2,096,168
Minority interests 177 174 – –
Total equity 1,310,915 1,613,263 1,822,111 2,096,168
Non-current liabilities 29 891,208 1,098,123 453,356 684,399
Current liabilities
Trade payables 27(a) 1,991,286 2,282,199 – –
Notes payable 27(b) 34,180 46,421 – –
Derivative financial liabilities 23,674 18,197 383 1,991
Provisions, accruals and other payables 28 1,509,925 1,944,724 18,945 13,955
Amounts due to subsidiaries 19(b) – – 329,039 93,201
Income tax payable 89,459 87,209 – –
Short-term bank loans 20,293 61,130 – –
Current portion of non-current liabilities 29(e) 437,359 48,581 435,000 35,000
4,106,176 4,488,461 783,367 144,147
Total liabilities 4,997,384 5,586,584 1,236,723 828,546
Total equity and liabilities 6,308,299 7,199,847 3,058,834 2,924,714
Net current (liabilities)/assets (318,823) 216,905 394,241 1,569,921
Total assets less current liabilities 2,202,123 2,711,386 2,275,467 2,780,567
On behalf of the Board
Liu Chuanzhi Yang Yuanqing
Director Director